Improving intent to purchase with mobile advertising: Success Story of Milpa Real

AI of Things    14 August, 2019

The Kantar Millward study demonstrates the effectiveness of the Mobile Advertising platform Data Rewards.

The objective of the Brand Lift study is to measure the effectiveness of an advertising campaign, identify whether it aids brand awareness, assess whether it is memorable and communicates the most relevant associations of the brand and finally determine whether the campaign shows an intent to purchase.

Movistar Ads Mexico decided to conduct the Brand Lift Insight Study together with one of the best known toast brands in Mexico, Milpa Real of Grupo Bimbo. Using the the winning formula of LUCA Advertising Data Rewards in a video format, the aim was to gain a better understanding of Mexican Toast culture.

Video of Milpa Rea for the Data Rewards Campaign

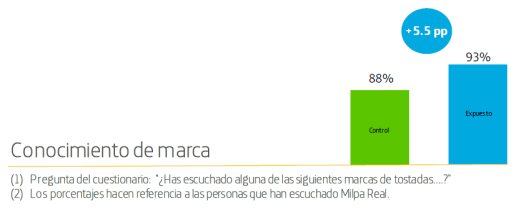
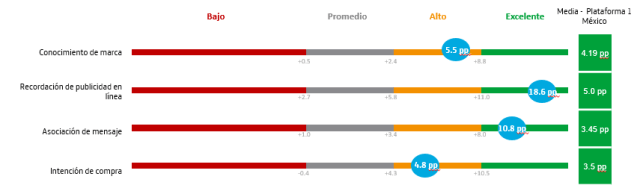
The results produced by Kantar Millward Brown regarding the variable of brand awareness were really amazing: the surveyed group, who were exposed to the campaign through Data Rewards scored 5.5 per person above the control group that did not see the campaign, which means that the surveyed group had a greater awareness of the brand.

Figure 1 demonstrates the difference in brand awareness between those who had seen the campaign and those who had not.
Figure 1: Brand Awareness

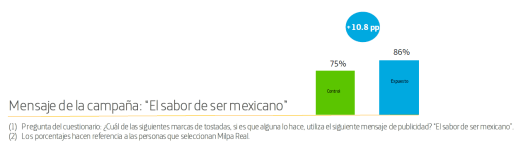
One of the indicators that most interested the brand was the association of the campaign/product message with Aztec culture. The result was excellent: the surveyed group scored almost 11 p.p. higher than the control group that did not see the toast campaign.

Figure 2 demonstrates the difference in the ability to identify the key message between those who had seen the campaign and those who had not.
Figure 2: Identification of message

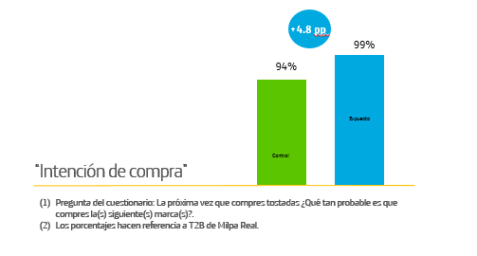
Kantar Millward Brown stated in the study that Milpa Real’s ability to increase Brand Awareness through the campaign resulted in a higher intent to buy, which was reflected in the score of 4.8 p.p. higher than the control group.

Figure 3 demonstrates the difference in their intent to buy between those who had seen the campaign and those who had not.
Figure 3: Intent to buy

Finally, it is worth mentioning the effectiveness of the Data Rewards campaign compared to other major digital platforms that have a bigger presence in the advertising market. In this case, the results were again favourable for the Data Rewards campaign.

In campaigns launched on one of these important platforms, the difference between the surveyed groups and control is much smaller (a difference of 2.8 p.p. in the message association variable) compared to the analysis conducted by Data Rewards (10.8 p.p. in the message association variable).

Figure 4 demonstrates the difference in message comprehension between those who had seen the campaign and those who had not.
Figure 4: The Brand Message has been understood and remebered by the chosen group.

To conclude, after analysing all the data presented in the study, it can be stated that LUCA Data Rewards is the mobile advertising platform that ensures 100% of a chosen audience not only understand the brand message but remember it also.

To stay up to date with LUCA, visit our Webpagecontact us and follow us on TwitterLinkedIn and YouTube.

Are data-driven strategies in the energy sector competitive? Naturgy proves it.

AI of Things    13 August, 2019

In today’s data story, we explore the success story of a large energy company, Naturgy, and how its digital transformation process towards becoming a data-driven company is already having a big impact, allowing them to position themselves as one of the leading companies in their sector.

Within the Development Framework of the Center Of Excellence (CoE), inorder to meet the centralization needs of both analytical initiatives and organizational needs, as an essential first step, it was necessary to define the strategic transformation plan within this data-oriented organization.

In order to tackle the challenge, with the help of the LUCA Consulting & Analytics, a global strategic assessment approach based on 4 axes was proposed.

  • Technology: evaluation of the current Big Data platform to provide a reference architecture on which to implement use cases.
  • Organization: defining an organizational structure capable of supporting the internal data governance program.
  • People: evaluation of internal skills with the purpose of offering them a training plan using the Tshape methodology.
  • Business: evaluation of the current level of analytical maturity and identification and prioritization of new use cases.

This allowed the execution of 3 use cases due to successful identification and prioritisation during the assessment process, as well as an analytical data audit project, which concerned multi-country infrastructure.

So what is the impact of this strategic approach on business and profits? Ramón Morote, Naturgy’s CDO, confirms the use of Big Data tools in a company like Naturgy could have “a direct impact on the business” in several areas.

The Project demonstrates the level of maturity of the company regarding its various data disciplines and how, thanks to LUCA’s experience, it has been feasible to obtain a tactical and strategic solution in all 4 areas of the project.

To stay up to date with LUCA, visit our Webpagecontact us and follow us on TwitterLinkedIn YouTube.

Discover the Connected Pool

Beatriz Sanz Baños    12 August, 2019

Did you know that in Spain there are around 1,200,000 swimming pools dedicated to leisure and sport? That means 1 pool for every 39 people! Spain is the country with the fourth most residential pools in the world, most of them concentrated in neighborhood communities, sports facilities and hotels. Now, we can go even further and create the IoT-connected pool. This swimming pool features the installation of smart sensors that not only facilitate greater efficiency and lower costs, but also save resources. Connectivity allows you to control all the parameters of the pool in real time through smartphone, tablet or PC, thus improving safety, sustainability and user services.

AI in Advertising: Prediciting Trends or Reinforcing Stereotypes?

Olivia Brookhouse    12 August, 2019

Have you ever noticed the stark differences between the advertisements shown on our respective Facebook pages, even under the same roof? From Husband to Wife, Mother to Daughter, Sister to Brother, our screens are inundated with an array of contrasting products, services and political campaigns. Whilst pregnancy test banners and dating site pop ups fill our screens, our male counterparts are targeted by extreme sporting experiences and tech products. Is AI revolutionizing the world of advertising or moulding us further into gender, race and age stereotypes?

With AI being in its early development, a mere toddler in the tech world, many questions are being asked about where AI is truly heading. SciFi films exaggerate the dangers of AI, of advanced robots who learn to outsmart their human controllers. In reality, it would seem the problems we face with AI are not too dissimilar to the contentious issues in society today, stereotype and bias.  

Facebook, Amazon and YouTube are just some of the many websites using Artificial Intelligence and Machine Learning to employ a more targeted approach, offering many benefits to companies and the end user, such as; increased efficiency and productivity, better customer support and personalized engagement. Whilst reducing ‘useless ads’ and limiting losses, how accurate is AI at predicting who we are? and therefore what we want? I fear the danger of targeted advertising is that AI systems predicting our habits are unintentionally learning our own stereotypes and bias and therefore may not ‘predict’ our habits but instead make assumptions based on gender, race or age. Does AI allow individuals to break the cycle of stereotype when algorithms aren’t built to challenge these norms?

In a tech driven world where AI is starting to be increasingly incorporated into recruitment processes, issuing insurance and advertising platforms, it is a crucial time to ensure AI does not learn our mistakes. Whilst data supplied to AI does not carry definitive statements such as ‘only hire engineers that are men’, AI can learn from inputted data which shows there is a higher proportion of engineers that men make more successful engineers and therefore the chosen candidate is male.

What is the solution? Diversity, Diversity, Diversity.

Teams that write algorithms and build AI in advertising or recruitment must ensure that they leave their own subconscious bias at home and input enough data to counteract pre-existing bias in data. IBM’s Susannah Shattuck spoke last month about the use of Watson OpenScale to battle this problem.

Starting today, we are making it easier to detect and mitigate bias against protected attributes like sex and ethnicity with Watson OpenScale through recommended bias monitors.

Furthermore, ensuring companies employ multicultural, multiracial teams with men and women who can build a system that recognizes, for example, statistically women are less likely to be successful computer programmers, not because they are less capable but because they have been less encouraged to pursue this career. AI in recruitment processes should be working with us, NOT against us.

AI is totally within our control to manage and develop because it only learns from the principles, values and conditions we give it. These therefore must be diverse enough to ensure AI becomes the open-minded citizen we want it to be. Studies conducted by companies such as Glass AI have used machine learning and computational linguistics to track the extent of gender bias in the UK.

Here at LUCA, we provide our clients with AI powered solutions in Advertising and Marketing campaigns. The importance of AI across sectors and countries is vast, a true tech revolutionary but like humans it comes with faults. Recognizing these faults and correcting them now means AI can truly be the champion in the tech ring for the next generation.

To stay up to date with LUCA, visit our Webpage, subscribe to LUCA Data Speaks and follow us on TwitterLinkedIn YouTube.

How the workers travel to Distrito T?

AI of Things    6 August, 2019

Written by LUCA Big Data for Social Good Team.

Telefónica operates in 17 countries and has presence in 24, however its central offices can be found in Madrid, in a business complex called Distrito Telefónica. The complex consists of 140,000 metres squared in which more than 13,000 people work every day, not including many visitors that also frequent the complex. But how does everyone navigate their way to the complex and where do people start their journeys? Do they primarily use public or private transport? And when are peak times?


These questions are very important in the face of the new sustainable transport design strategies which would reduce the environmental impact of transportation whilst making the service more convenient and efficient for everyone.Telefónica´s global Environmental Team is designing a sustainable transport plan for Distrito T. The scientists from LUCA´s team, Big Data for Social Good are currently working together, using Big to analyse the daily movements of the employees of Distrito Telefónica.  

The data from the study shows the movement of people to Distrito T during November 2017, with the majority being workers located in the complex. The data is anonymous and has been stored on the company’s own servers, providing the corresponding security. The dataset comes from three various high-quality sources; LUCA smart steps mobility data platform and the Transport Consortium of Madrid which records ticket uses within the public transport network (bus, metro, commuter train) whose routes end at the Ronda de la Comunicación metro stop. The final source of data is the total number of arrivals to Distrito T, including the daily number of arrivals by personnel in and out of any of the buildings as well as from the underground carpark.

The analysis of routes and variation in times of arrival and departure to and from District T.

The study compiled these three data sources. Routes were selected from the platform Smart Steps which, during November 2017, terminated within the red shaded area of the figure.

 
En Smart Steps se seleccionaron trayectos con destino en las áreas señaladas en rojo.
Figure 1: From Smart Steps, journeys were selected which terminated in the red zone.
 

The inability to define the exact location within the zone is due to the topology of mobile phone calls. We estimate that 6% of the dataset included in the study, did not in fact terminate in Distrito T, but instead in the nearby area.

The graph below which maps the variation of journeys made, measured by mobile networks and metro trips, reveals an average number of 11,738 journeys daily (excluding public holidays) of which 1,750 were made by public transport (referring to those who used the metro above).

Volumen de trayectos únicos según Smart Steps y Red Pública de transporte,
  Figure 2: Volume of single journeys according to Smart Steps and the Public Transport Network.

We compared this dataset with the entries recorded at the entrance of the buildings, recording a daily average of 11,102 employees which constitutes the baseline inflow of people.

Usuarios únicos con entrada a un edificio de Distrito.
Figure 3: Unique users with Access to the building of Distrito T.

Data regarding the use of parking represents a range between 40% and 47% of this baseline, of which 20% are estimated to come in a private car, parking on the ground level and with 19.5% using public transport. Furthermore, if we analyse the modes of transport used, we can obtain an accurate insight into 86.5% of the total workers. It is important to point out that the study does not consider the possible impact of the opening of the new underground car park near the East-South squares of District T.

Volumen de personas según medio de transporte utilizado.
  Figure 4: Volume of people based on mode of transport used.

Another aspect we analysed is the variation of arrival and departure times, which has a direct impact on congestion in the area around peak times.

Analysis of journey origins and travel times.

Two essential factors when choosing a mode of transport, and therefore important to the proposal of more sustainable alternatives, are the location of the worker’s residences and their total travel times. Using Smart Steps (routes inferred from the movements of mobile phone signals), we extracted the locations throughout the Community of Madrid from where their daily journeys started to where they ended, in this case, Distrito Telefónica.

Next we present a similar map, this time using the analysis of arrivals by people registered in the public transport network (bus, metro and commuter train) destined for Ronda de la Comunicación metro stop

Volumetría de entradas registradas en la red de transporte público con final en la parada Ronda de la Comunicación.
  Figure 5: Analysis of arrivals by people registered in the public transport network destined for Ronda de la Comunicación metro stop.

Both maps show coherence with respect to the areas of high density of routes with similar origins (Northeast of the city, central axis of Castellana and Alcobendas), but at the same time we observe a high volume of route origins, from which public transport is not used, perhaps for reasons of convenience in terms of travel time. In the following figure above (right) we have marked these areas in dotted line. These areas would be ideal for proposing the use of carpooling schemes as they are located far from Distrito T, have a radial orientation, and therefore people have little choice but to use a private vehicle.

Travel times on public transport could be accurately measured by calculating the time between the validation of the ticket/travel card and the exit from Ronda de la Comunicación metro stop. However, timing a private vehicle is more complex. For this reason, we have resorted to the use of the public API of Google Maps. This API provides us with an estimate of travel time between two points at a given time and the mode of transport used. For example, in the case of measuring the travel time between Chamartín and Distrito T, it gives us an estimate of the journey by car between 12 and 26 minutes.

 Estimación de la duración del trayecto usando Google Maps.
  Figure 6: Estimation of travel time using Google Maps.

On the other hand, we do have our own interactive map of travel times on public transport. There are two types of passengers:

  • Multimodal: : Those who use bus or commuter trains and switch to the metro network to get to Distrito T.
  • Unimodal:  Those that make the entire journey to Distrito T by metro.

The following map illustrates the demand for the use of the different metro stations. The larger the size and darker the colour reflecting a higher demand.

Demanda de uso de las estaciones de metro, mayor a mayor tamaño y color más oscuro.
  Figure 7: Demand for the use of metro stations . The larger the size and darker the colour reflecting a higher demand.

As we can see, Chamartín station is the most used. However, looking more closely, the majority of users who travel to Distrito T through this station are multimodal (92.7%), therefore travelling from more distant locations. The stations with the highest multimodality figures are Chamartín (92.7%), Príncipe Pio (76%), Conde de Casal (62%), Moncloa (53%) and Nuevos Ministerios (42%). This analysis is relevant due to the significant differences in travel times between multimodal and unimodal users. In the case of Chamartín, multimodal users take 61 minutes to get to Distrito T, compared to metro users, taking on average 22 minutes.

Figura 8: Porcentaje de uso multimodal de la estación.
  Figure 8: Percentage of multimodal station use.

Next, we obtained a map of average travel time on public transport grouped by postcode, which may be insightful for those who consider using this mode of transport:

Duración media de trayecto en metro por código postal.
Figure 9: Average journey time by metro, grouped by postcode.

In addition, we obtained a granular version (in the hexagonal grid) of the travel time in public transport.

Tiempo de desplazamiento en minutos, metro y multimodal.
Figure 10: Travel time in minutes, metro and multimodal.  

If we compare this map with the one obtained from Google’s estimations of travel by car, we obtain a new map in which we can identify the difference in travel time between private car and public transport in each zone.

  • Green: Travel by public transport causes a delay of up to 10 minutes compared to transport by private car.
  • Light green: Travel by public transport causes a delay of up to 20 minutes compared to transport by private car.
  • Orange: Travelling by public transport causes a delay of up to 30 minutes compared to transport by private car.
  • Red: Travel by public transport causes a delay of more than 30 minutes compared to transport by private car.
Intervalos de diferencia en minutos: transporte público versus coche.
  Figure 11: Difference in travel time between private car and public transport in each zone.

To conclude, we can highlight the following when recommending the use of public or private transport to reach the District: It is advised to consider the use of public transport as opposed to a private car in all areas marked in green (especially those in dark green) as they would not experience a significant delay and moreover would benefit from numerous advantages (sustainability, environmental impact, economy, etc.).

We hope you have found the study interesting and has encouraged you to follow our blog to read more stories behind the Data.

To stay up to date with LUCA, visit our Webpage, subscribe to LUCA Data Speaks and follow us on TwitterLinkedIn YouTube.

Five interesting own tools that you may have missed (and a surprise)

Innovation and Laboratory Area in ElevenPaths    6 August, 2019

This time we are going to rehash a blog entry by gathering some of the own tools that we have recently developed and we consider of interest. We summarize their functionalities and accept suggestions. We recommend paying attention to the whole post, since we have included a new tool that we have not completely announced yet.

PsicoWiFi: An integral anonymity and Wi-Fi management suite on Windows

When you connect to a Wi-Fi network you are giving a lot of information to third parties. Ranging from your MAC address to potential hidden or public networks that you have ever accessed. For this reason, we have developed a tool with the aim of making the most of Windows functionalities allowing anonymity, as well as controlling our Wi-Fi networks at all times: from when we are connected to what passwords they have; from the generation of random MACs, to the control of hidden SSIDs. PsicoWiFi allows to comfortably enhance privacy and Wi-Fi connection control from a single tool, centralized and easy-to-use.

https://youtu.be/TIxKwN3Qp14

You can download it from here.

PESTO: Are your binaries secure when facing vulnerabilities?

One of the fundamental dangers in IT security are vulnerabilities in general, and the capacities to exploit them to execute code in particular. Historically, a high number of technologies have been developed to mitigate exploit capabilities to work in Windows, so creating barriers to prevent a buffer overflow vulnerability from ending up in code execution. Many of these barriers need that the binary to be protected (or that does not help to the exploit) may be compiled with a particular option enabling real protection. PESTO−PE (files) Statistical Tool−has been created to analyze how and how many files are protected on the operating system.

You can download it from here.

Pin Patrol: Controlling HSTS connections from your browser

It is a Firefox and Chrome extension that shows, in readable form, the HSTS (HTTP Strict Transport Security) and HPKP (HTTP Public Key Pins) state of the domains stored by the browser. Neither Firefox nor Chrome have a native way to see it, and they do not document too much this information.

Pin Patrol arose from an investigation that led us to the Black Hat, Rooted, as well as to create cloudpinning.com for testing. Even Facebook used it as an excuse to implement a kind of inverse HSTS.

You can download it here for Firefox and here for Chrome.

NETO: the most complete suite to perform analyses on plug-ins, extensions and browser plug-ins

From ElevenPaths’ Innovation and Labs we have created a new tool to analyze browser extensions. It is complete suite (also extensible with its own plug-ins) to analyze extensions; it is easy to use and provides useful information on extensions’ own features, both of Firefox and Chrome or Opera.

The extensions contain relevant information such as the version, default language, permissions required for their correct working, or the URL address structure on which the extension will operate. Furthermore, it contains pointers to other files such as the relative HTML file path that will be loaded by clicking on its icon, or JavaScript file references which should be run both in the background (background scripts) as with each page loaded by the browser itself (content scripts).

However, the file analysis that makes up an extension can also reveal the existence of files which should not be in production applications. Among them, it could appear files linked to the management of versions such as GIT or other temporary and backup files. Of course, there are also extensions which are created as malware, adware, or to spy on users.

https://youtu.be/DksblHdRnf0

All the instructions to use it, and even if you feel encouraged to write plug-ins for NETO itself, are available here.

CCW: Monitor your clipboard to prevent thefts in bank transfers

Since 2017, the crypto clipboard hijacking technique is becoming quite popular. Cryptocurrency in general constitutes a new target for malware, and mining Bitcoins is not profitable anymore in “standard” computers (maybe Monero is). However, targeting the clipboard to steal cryptocurrencies is a new, simple and interesting formula that malware creators are exploiting. Examples such as Cryptoshuffle, Evrial or N40 BotNet show this.

For all these reasons we have created a simple tool that monitors your clipboard in order to warn you if the cryptocurrency destination address is changed.

CCW is really simple. Install it from here and it will let you know if your clipboard is switched.

https://youtu.be/daOXXOFMPdI

Next version will be soon released, that will protect bank account numbers as well.

DIARIO: Analyze your documents without sharing them

And the surprise came: our malware detection system and privacy protector that has only been announced at the Rooted 2019 and over our Innovation Day.

DIARIO can be consumed in several ways:

  • A system to analyze malware in documents. You only have to visit https://diario.e-paths.com and drag your file there. Keep calm, we will deliver the results without sharing your file with anyone or anything; and wholly outside antivirus technologies, so you may have an additional opinion.
  • If you do not trust it, it’s OK. Use our API where you will be able to create your own client, see that the file is not sent to the server, automatizing, etc.
  • We only keep what we need from the file (for instance, docs macros and PDF JavaScript), so we have a solid data base for analysts. Do you want to try this functionality? Write us via [email protected].

Waste collection vehicles join the RevolutIOTn

Fernando García Gómez    31 July, 2019

What’s the impact of technology in our lives?

Undoubtely, it makes our daily life easier both in the personal and profesional field, allowing us to obtain more benefits with less cost and effort. Technology, when applied to telecommunicatios and mobility, opens up a world of possibilities and makes culture more accesible to everyone. 

Second question is: how does all of this impact on the environment we live? Is it possible to continue living without depleting the planet’s resources? Yes, it will be posible thanks to energy efficiency, key factor to keep running the technological race generating the least posible impact.

We speak of an efficient use of energy when we use new technologies that require a smaller amount of resources than we have been using so far. This way the perfomance to do the same task is considerably greater and the impact would be much less aggressive for the planet. It’s a win-win. Energy efficiency is also necessary because, due to the increasing energy consumption worldwide, costs also decrease. This leads us to continuously look for new sources of energy, renewables and clean, that could guarantee the supply, not only in the present, but in the long term.

A recognised case of energy efficiency is that of Ferrovial Servicios, the services company, which has been recently awarded with the EnerTIC prize for the project Smart Vehicle carried out with Telefónica and Geotab. This is an IoT Project for innovation applied to the vehicles they use on the management of their contracts. The project has been implemented jointly by Telefónica and Ferrovial Servicios on a great part of the vehicle fleet of the services company. This award recognizes the innovation to achieve energy efficiency in the digital era, in order to value the use of technologies to improve efficiency and sustainability.

The project connects all vehicles through a telematic device that sends real-time data such as GPS location, routes, speed, consumption and drivers’ behavour to an internal platform. This way, the analysis of the data allows them to improve their operations, to stablish efficient driving rules to reduce consumption and CO2 emissions and to improve safety. In addition, this program facilitates the transition towards the use of less fossil fuels, increases the safety of vehicles and reduces company costs.

In conclusion, a shift towards a more sustainable use of energy is possible and technologies like IoT are key to achieve it. Thanks to the precise information provided by telematics and the automated analysis that is made of the data, we can optimize processes, which leads to greater productivity with minimal expense.

Uncovering APTualizator: the APT that patches Windows

Innovation and Laboratory Area in ElevenPaths    29 July, 2019

By the end of June 2019, we assisted to an incident were a high number of computers had started to reboot abnormally. In parallel, was detected a file called swaqp.exe, which apparently was not available on any antivirus aggregator or public platform at that time. We tried to determine if such file may have caused those reboots and if we were actually facing a malware threat.

It caught our attention that in a first quick analysis we noticed that the sample downloaded the KB3033929 legitimate security update for Windows, although from an unofficial server. In other words: it installed the legitimate file (signed by Microsoft) from an unofficial server. It is not a typical malware behavior for two reasons:

•  Malware creators usually develop their artifacts by minimizing additional dependencies (libraries) that might not be included in potential victims’ computers.

• Malware is rarely interested in updating computers, still less in attempting to update them with any patch. It is not the usual behavior in the context of a potential malware sample.

Following this, we began to investigate. We found an APT that we have called APTualizator.

Why would it update?

The code of swaqp.exe checks if the system has an earlier version of Windows 7 on the desktop and Windows Server 2008 R1 on server version. In such a case, code execution process will terminate. The mentioned security patch is only available for these versions, so it makes clear its goal with that action.

For the executable downloaded from the C&C to run at the kernel level, it will be installed as a driver of the operating system. As we know, on Windows this involves that the binary must be signed by one of the Certification Authorities allowed on the operating system to be executed as a Kernel, thereby offering certain guarantees to the critical software triggered on the system. Driver signature and authorization system on Windows is very demanding in recent times.

So far, we have a malware that performs legitimately an update on the system and downloads what seems to be a driver (that must be signed to be installed). Why would the attacker update the operating system of a victim? To answer this question, we need to understand the changes included in this patch and how it is related to the rootkit installation.

If we go over the details of the certificate used to sign this executable, we can see that SHA256 as a hash algorithm is used. Here is where we start to infer the malware behavior. KB3033929 is a Microsoft update issued in 2015, which is in turn an update of a patch released by the end of 2014. Windows 8 versions or later support signature verification with SHA256, but Windows 7 or Windows 2008 R2 do not. Microsoft had to issue this patch to continue supporting these versions (Windows 7 and 2008 R2), while the earlier ones (Vista, 2003, XP…) remain unable to verify those signatures created with hashes SHA256, and the later ones have natively this feature.

Therefore, the attackers apply the patch KB3033929 so that the verification of the signed driver may be valid. We infer that the attackers only had that signature possibility, so they had to adapt the victim to the malware (by updating the capacities of the operating system) and not the other way around.

For this purpose, we check the driver signature:

Surprisingly, it is signed with SHA256, but with SHA1 as well. This is a usual practice of Windows updates, for instance, for some time now, for the updates to work on Windows 7, 2008 R2 and the remaining systems. But in the case of updates, SHA1 hashes are signed by certificates different to SHA256 hashes in the same sample. In the case of this malware, both hashes SHA1 and SHA256 are signed by a SHA256 certificate.

This is a little strange action performed by the attacker. We infer that it only had a single certificate SHA256, so needing to update the system for the target Windows to verify the validity. The fact that it was signed by SHA1 may constitute a simple previous test performed by the attacker.

References to McAfee and Potential attribution by country

Over the sample execution there are constant references to McAfee that make it change the malware behavior depending on whether antivirus processes are running or not. This is the main antivirus engine installed in the affected computers. A significant part of the malware behavior is contingent upon the existence of this antivirus on the computer. This might suggest a targeted attack.

As an example, in the first line of the following image we can see a reference to a function that we have renamed as writeLog_if_mcafee. We found at least seven more references or internal verifications related to the existence of McAfee.

Moreover, we found a code snippet where the sample checked the language of the victim’s keyboard, according to which they would go ahead with the infection or not. This is quite usual. Nevertheless, the case found here is a little bit different. Instead, we found a range of up to 43 languages that, through consecutive language identifiers, would be freed from the infection.

This report has been issued by the team of researchers from the CSIRT-SCC, in collaboration with ElevenPaths.

Those countries that would not be affected -and among which the presumably threat source is located- are the ranges between 0x18 and 0x43. Russia is precisely within the list of these 43 countries. This may suggest that:

  • The authors are within the range, and the remaining ones were included to make unclear the authorship of the attack.
  • The attack was targeted, since if it had been an undefined-victim attack, it would make no sense to have excluded so many potential infections (up to 43 different language identifiers would be excluded from the attack). It is important to point out that the only relationship between these identifiers is that they are consecutive. In other words: they do not constitute a close group neither geographically nor politically.

A report issued by the team of researchers from the CSIRT-SCC, in collaboration with ElevenPaths.

How AI is revolutionising the Classical Music industry: An analysis of the musical AI by Aiva Technologies

Stefan Leadbeater    26 July, 2019

Previous posts by LUCA have touched upon the increasing use of AI in the music industry. Today however, I would like to focus on its use in the area of classical music.

Over previous years many different companies have developed AI technologies with the ability to compose classical music, without human intervention such as ‘Iamus’ created by the University of Málaga, however, the one which has stood out above its competitors is Aiva Technologies, one of the leading start-ups in the field of AI music composition.

Aiva Technologies was founded in Luxembourg and London by Pierre Barreau, Denis Shtefan, Arnaud Decker, and Vincent Barreau and the AI which they have created is called ‘Aiva’ (Artificial Intelligence Virtual Artist).

In 2017, the company was invited to participate in the European Film Market in Berlin, a highly acclaimed event as well as the Artificial Intelligence in Business 6 Entrepreneurship (AIBE) Summit in London. On top of this, having released an album titled Genesis and many other single tracks, Aiva became the first AI in the world to officially receive the status of Composer and became registered under France and Luxembourg’s authors’ right society (SACEM), where its music can now be copyrighted to its own name.

The following video is a TED talk given by Pierre Barreau, one of the founders of Aiva giving a more detailed explanation of the expansive capabilities of the AI technology.

How does the technology work?

The technology behind this innovative AI is based on deep learning algorithms that use reinforcement learning techniques.

Deep learning is a particular type of machine learning in which multiple layers of “neural networks” are programmed to process information between various input and output points. What this does is allows the AI to be able to understand and model high-level abstractions in data, such as melodic patterns.

As mentioned, reinforcement learning is also used with this AI technology. Before describing what exactly this form of learning is, it is important to understand the purpose of its name. In psychology, reinforcement is used to motivate and encourage future behaviours using stimulation and motivation. This is done through the use of positive and negative reinforcement through the use of rewards and penalties.

It is a machine learning technique which teaches an AI to decide on the avenue to go down and which decisions to make in order to arrive at a set objective. Reinforcement learning is an approach to machine learning which is inspired by behavioural psychology. It differs from supervised learning in that the algorithm is not explicitly told how to perform a task but works through the problem by itself and ‘finds its own way’. At the centre of reinforcement learning sits the use of reward signals which are awarded upon performing specific tasks and help to navigate the algorithms towards a better understanding of what the right and wrong courses of action are. Positive rewards signals are given to encourage the continuation of a performance of a particular sequence of action, whereas negative reward signals act as a penalty for performing activities which are not in line with reaching the final objective. This in turn helps the algorithm to correct itself in order to stop receiving these penalties.

The Aiva team have stated:

“We have taught a deep neural network to understand the art of music composition by reading through a large database of classical pieces written by the most famous composers (Bach, Beethoven, Mozart, etc). Aiva is capable of capturing concepts of music theory just by doing this acquisition of existing musical works”.

However, it is important to remember that this technology, although making huge leaps forward, is still in its infancy. Having said that, this year, Aiva Technologies opened their AI music composition platform for early beta testers and even though the track customisation is still quite minimal at this stage, the current AI musical styles offered by Aiva include: Modern Cinematic, 20th Century Cinematic, Sea Shanty, Tango, Chinese and Pop/Rock.

Along with this exciting release, this video shown below was released showing just how far the algorithms have come:

https://www.youtube.com/watch?v=3ObkDWmKEEA

Regarding the future of Aiva, the team is planning to eventually teach it how to learn any style of music. However, there is a challenge which is presented by modern music which is not anything to do with its composition, but about the instrumentation and sound design.

Even though some of the works created by Aiva have been used in films, adverts and even game studios, instruments, as we all know, have their own specific sounds and unique qualities, only fully explored through being played by humans. As a result, trying to recreate these sounds and effects with an AI is posing, and will continue to pose a great challenge in reaching perfect human-level performance and really taking this type of AI to the next level.

It is hard to know whether music created in this way will ever be indistinguishable from that of music composed and played by actual musicians. Having said this, testing has already begun using expert musicians to compare Aiva’s creation to music performed and recorded by actual musicians and so far they have not been able to tell the difference between the two.

IoT for a better world

Beatriz Sanz Baños    25 July, 2019

The Sustainable Development Goals (SDGs) are a United Nations-led initiative to address the most important problems our society faces. It encompasses “a set of interconnected social, economic and environmental goals and objectives” that form part of the 2030 Agenda for Sustainable Development. 

The Internet and digital solutions – with the basis of connectivity – are essential to achieve many of the goals that have been set: to improve people’s quality of life, to facilitate equitable growth and to protect the planet. At Telefónica, we use these goals as a roadmap to achieve sustainability and build a better world in which no one is left behind. 

(Strategic SDGs for Telefónica: greater contribution)

In this sense, the Internet of Things has enormous potential to help meet these SDGs. It plays a key role in developing solutions to reduce the negative environmental impact of cities, help the economic growth of the industry and promote quality education.

As a company, Telefónica contributes to multiple SDGs related to different business areas. But which specific goals does IoT help reach?

Industry, Innovation and Infrastructure (SDG 9)

The impact of startups on economic development is increasing and, in general, such companies are closely related to technology. Many innovative ideas have been launched on with the foundation of the connectivity provided by the Internet of Things.

Initiatives such as theIoT Activation Program provide connectivity modules, access to labs to test NB-IoT solutions with engineering support, and platforms like Kite, which provide connectivity management and cloud integration.

 Quality Education (SDGs 4)

IoET (Educational Internet of Things) devices have great potential to stimulate students’ abilities and facilitate flexible learning and creativity. 

Interactive devices have been immersed into classrooms and turned them into connected learning places where students can unleash their imagination thanks to new tools that encourage them to learn.

From connected backpacks, which ensure the safety of the little ones with a geolocator and dining rooms with RFID technology to monitor food intolerances, to scanners like Scanmarker, an underscore that digitizes the text that is marked on the book to be able to edit, listen to or translate it on your tablet or computer.  

To ensure that no one is excluded from these advances, there are also formative plans to incorporate key technological competencies in the Internet of Things sector, such as Artificial Intelligence, Blockchain or Big Data.

  Labor and economic growth (SDG 8)

The increase of productivity is made possible by monitoring the various business processes with IoT technology. Industry 4.0 uses sensors in order to optimize product manufacturing processes, Retail to create smart stores that tailor its services to the demands of its customers, and fleet optimizer companies to track vehicles and prevent accidents. All these improvements translate into economic growth and have a positive impact on the day-to-day lives of workers, improving their overall working conditions and safety.

 Sustainable cities and communities (SDG 11)

The use of IoT by public institutions is critical to the development of Smart Cities, as the use of smart sensors to monitor aspects such as lighting, pollution, irrigation, traffic or the conservation of monuments makes for a more effective and sustainable management with the environment and our health.

On another note, the use of connected drones is already a reality in the fight against natural disasters, through actions such as theprevention and extinguishing of fires or the search for survivors in floods and earthquakes.


Affordable, non-polluting energy (SDG 7)

IoT technology contributes decisively to the development and implementation of renewable energies. As a result, public institutions, companies and individuals can reduce their carbon dioxide emissions. Connectivity also applies to Smart Waste, intelligent waste recycling management that uses sensors that monitor the status of trash bins.

In addition to all these contributions, projects such as Internet For All stand out, which aims to provide Internet access to 100 million people in Latin America by 2025, or Smart Rural Territory, which brings IoT and Big Data solutions to administrations of the “emptied Spain”.

Infrastructure development, the digital divide, economic growth and pollution are some of the main problems we face. The commitment to sustainable innovation must be a priority in order to address them, as the solutions provided by connectivity help us to successfully overcome these great challenges.

As the United Nations asserts, “it will not be possible to achieve sustainable development without radically transforming the way we build and manage urban spaces.” In this sense, IoT plays an essential role in achieving the objectives set out in the 2030 Agenda.

If you want to know more about Telefónica’s commitment to the SDGs, click here