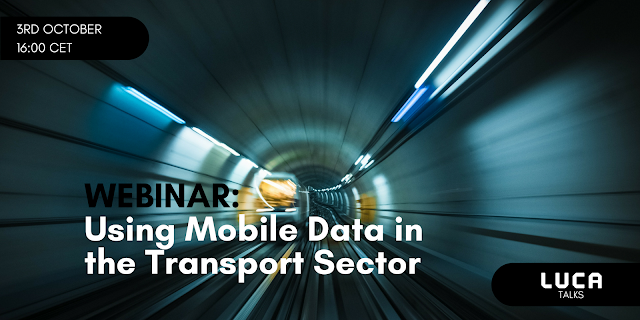
It’s not too late to catch up!
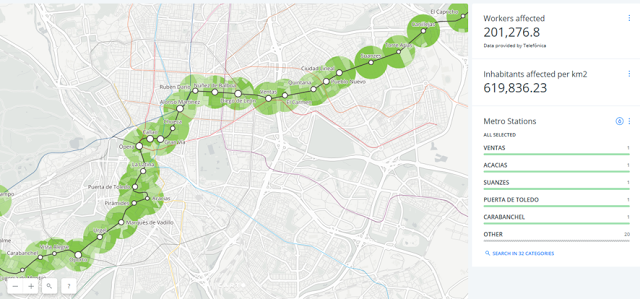
If you have not seen yet our LUCA Talk you can do so below:
Don’t miss out on a single post. Subscribe to LUCA Data Speaks.
If you have not seen yet our LUCA Talk you can do so below:
Don’t miss out on a single post. Subscribe to LUCA Data Speaks.
While the explosion in smartphone apps has led to our web use becoming far more targeted, browsing in the original sense remains fundamental to some of the most popular apps in the market.
![]() |
|
|
In Brazil, six leading online retailers—Magazine Luiza, Mercado Livre, Netshoes, Privalia, Natura and Zattini—have all reported increases in usage of their smartphone apps since they began providing sponsored data. Overall session numbers have increased, as well as average session lengths (the app equivalent of in-store dwell time).
“Treat the customers as guests when they come… Give them all that can be given fairly, on the principle that ‘to those that giveth shall be given’.”
Don’t miss out on a single post. Subscribe to LUCA Data Speaks.

For fans, one of the most exciting days of the season is transfer deadline day. Although last minute deals can happen, the vast majority of signings are the result of months of scouting. Historically, this would involve assigning a scout to watch a player, to write reports on their performances, and then provide feedback to the club. For the majority of clubs this is still a vital job for the scouting team, but data-driven scouting is on the rise. For example, Arsenal paid over £2million for the US company
StatDNA, whose data has since been used to advise their signings.
![]() |
| Figure 1 : Data can help clubs make better signings |
Perhaps
the poster boy of this new approach is Matthew Benham, the owner of London’s Brentford
FC and Danish club FC Midtjylland. Benham made his millions using an analytical
approach to bet on football matches and he brought the same mindset to running
a club. The data collected on players is used to build a database within which
the club can search for a player who can better suit the team’s playstyle. Brentford
signed both Andre Gray and Scott Hogan using this approach, and both signings were very successful. The huge
profits made on these players shows that the data-driven approach also has financial benefits.
Additionally, signings are not made on ‘hype’, which arguably means that
decisions are more rational.
Wage
negotiations can often be an obstacle to transfer talks, as the various
interested parties often disagree on a ‘fair’ wage. A report from the International Journal of Computer
Science in Sport reveals how Big Data can be used to analyze the salaries of
top players in Europe. The data scientists computed the salaries of players
based on 55 metrics (from goals scored, to aggression and ball control) and
compared this to the actual salaries from the previous year to reveal overpaid
and underpaid players. Arguably, this method could be used in any industry
where there are identifiable attributes in order to determine fairer wages.
![]() |
| Figure 2 : Training with connected equipment |
![]() |
| Figure 3 : Tactics can benefit from data insghts |
Don’t miss out on a single post. Subscribe to LUCA Data Speaks.
![]() |
| Figure 2: Google´s self-driving car is beginning public trials in Pheonix, AZ |
Don’t miss out on a single post. Subscribe to LUCA Data Speaks.
![]() |
|
|
![]() |
| Figure 3: Pilot Project in Sao Paulo |
To reach the project objectives, it is required to collect and analyze mobile and environment data from sensors, as well as, any other data source that could provide valuable information for this purpose.
The project expects to show that correlation of mobile device data location with other datasets will allow to uncover insights and valuable information for local administration about how to improve traffic distribution. Moreover, the trial could come up with additional social and environmental policies that can improve citizen lives.
In addition, this project gives Telefonica a stronger “right to play” in the commercial big data space: we don’t use our customer data only for our own benefit, but we use that same data to help improve the world, “giving the data back” to society.
Don’t miss out on a single post. Subscribe to LUCA Data Speaks.
![]() |
| Figure 1: Helping you to save money |
![]() |
| Figure 2: Helping you to save on your next holiday |
Don’t miss out on a single post. Subscribe to LUCA Data Speaks.
With an estimated annual usage in excess of 1.065 billion users, the London Underground only finds itself 11th in the list of busiest metro systems. This example shows the importance of mobility planning in major cities as well as the potential congestion if these users drove instead. The daily movement in our cities generates enormous amounts of data. LUCA Transit is the solution that harnesses this data (particularly mobile data) to provide insights for the transport industry. These insights can improve safety, congestion and event planning, among many others. You can see an example of LUCA Transit at work here.
![]() |
| Figure 2 : Tom Brealey (l) and Oscar Garcia Costa (r) |
The webinar will take place on the Tuesday 3rd of October at 4pm and you can register here!
The Madrid Metro is undertaking important improvements on their transport network. This year, Line 5 which links the southeast-northeast zones to the capital, is the third to display the notice of “closed for network improvements”
So that those publically responsible for the sector can make better decisions about how and when to undertake this type of improvement work in an informed and transparent way, it is essential to understand the impact that these actions have on citizens and their economic repercussions.
Today, thanks to location data generated by technological devices, such as IoT (internet of things) sensors and smartphones, it is possible to measure how these maintenance projects affect the population. Therefore, we decided to investigate what type of response we would obtain from the system of location intelligence, combining public open data with data insights from mobile phones.
As with what they achieved on line 8 at the start of the year, the Madrid Metro worked to offer a better service to citizens, by carrying out maintenance works as well as improvements in signposting and lighting. But making the decision to close an infrastructure like this in such a heavily populated area is never easy. In this instance, the decision on the best time to undertake the works was based on seasonality. Therefore, the closure of the line took place in the summer months as there is less demand in this period due to summer holidays.
Nevertheless, how can those responsible of making decisions in the city truly know the best time for the closure? How can they make use of previous closure experiences on other lines to optimize future maintenance works?
Making decisions based on Intelligent Location data is the first safe step to minimize the negative impact on the public transport system.
Line 5 of the metro is the 4th most popular line for the residents of Madrid, transferring passengers from the outskirts of the city (areas such as Carabanchel and Ciudad Lineal) to the city center. The closure of the line is most detrimental to the residents of these zones, as those who live in more central zones have access to a greater variety of transportation alternatives.
In order to analyze movement patterns in a city, it is fundamental to know where the people who are moving live and where they work. This data can be found in different ways. For example, according to the “Atlas de la Movilidad”, in the district of Carabanchel the greatest number of workers live (followed by Vallecas, Latina, Fuenlabrada and Móstoles, all of which are located in the southern zone). Nevertheless, the area of Julián Camarillo (also on Line 5, station Sauces) is the most used area of offices and work places (after AZCA, Barajas, Gran Via and Valportillo in Alcobendas).
This shows that the majority of the workers reside in the south of the city, but have their workplace in the north. Therefore, workers in the zone of julián Camarillo will be the most affected by the closure of the line.
Nevertheless, in order to offer high quality location intelligence, our partner Carto decided to go one step further and make contact with one of their partners, us. Here are LUCA we were able to bring a greater granularity and understanding, thanks to our platform LUCA Transit which uses aggregated and anonymized data from mobile clients, allowing a better understanding of how groups of people move.
The Smart Steps technology allows the identification of particular “points of interest”, based on recurring locations of mobile telephones (offering movement trends that cover approximately 40% of the Spanish population). In this particular case, the points of interest to study were the place of residence and the place of work.
One of the most relevant insights that reflects the data (as you can see below) is that Line 5 journeys covering areas outside of M30 ring-road carry more than 50% of the passengers that use the line. This highlights the fact that the residents of the outskirts are the ones who suffered the greatest impact from the closure.

Once the first challenge of using location data to generate Insights has been overcome, it is fundamental that those publically responsible receive investment for projects based on data to make better decisions for the benefit of the city.
For example, this information can be used to choose suitable routes and time frequencies for the replacement bus service. The passengers who live in the center may have 2 or 3 bus routes that can be used as an alternative. However, passengers in the outskirts of the city, that we are analyzing in this study, do not have many other options.
The local authorities can also decide to launch geomarketing campaigns in order to raise awareness for the available transport alternatives during the works, or to promote the use of shared vehicles in suburban areas. This has the objective of alleviating the negative impact on transport during the works.
In summary, it is clear that the use of location data for the optimization of decisions on infrastructure and movement is of great value to the authorities who want to bring transparency to their decision making process. Citizens want to live in more intelligent and efficient cities. Location intelligence is a powerful tool for leaders who want to make data the cornerstone of their strategy and public service.
If you want to know more about this topic, visit LUCA´s website.
Firefighters work in a highly pressurized environment where time is short and lives are often at stake. During the journey from the station to the site of the fire, information arrives from many sources including tablets, Sat-Navs, manuals and radios. Bart van Leeuwen, a Dutch firefighter and founder of Netage, suggests that this information overload is one of the main problems that fire services face. He often uses the example of the Anne Frank house in Amsterdam to highlight this point. The average journey time is 59 seconds, and in this time, the team must read five pages of reports on the building.
Even if we assume that a human being can absorb this quantity of information in such a short timeframe, no amount of preplanning can make you 100% prepared. The Black Swan Theory refers to Western explorers who, having discovered black swans in Western Australia, decided that they were not in fact swans, because they understood all swans to be white. The subsequent theory that Nassim Nicholas Taleb developed describes a surprising event that is rationalized in hindsight. ‘Black Swans’ are commonplace for firefighters, as well as doctors and police officers.
How can we overcome these issues in order to create smarter emergency services? Van Leeuwen argues that harnessing data is the key. Data is being created and collected at an exponential rate but an app that simply contains this information is no longer sufficient. Rather, access to the data is what is needed, so that data scientists with a passion for Social Good can work with the data to discover insights that the emergency services themselves may not see. ‘Open Data’ would facilitate this, and van Leeuwen argues that it must be a two-way transfer. As such, the Amsterdam fire department publishes their data in an open format at the same time as requesting access to data. One example is the ‘Firebrary’, a library of technical terms developed so that everyone can be on the same (web)page.
![]() |
| Figure 1 : Amsterdam; the city using data to create smarter fire services. |
‘Open Standards’ for data would bring consistency and make working with Open Data even easier. If the world were to adopt Open Standards, ‘Linked Data’ would become an even more powerful tool. A great example of Linked Data is Wikipedia, where one link on a page leads to another page, containing more information and more links. Put simply, Linked Data unlocks information. In Amsterdam, the fire department posted live tweets of fire incidents which contained links to detailed data of the event and key terms on the Firebrary. Firefighters could therefore know the full details of the incident in a matter of seconds, and could even be warned if they were about to face a ‘Black Swan’
Mapping the environment in which the
emergency services operate is also possible using Big Data. In the case of the
fire department in Amsterdam, this involved using data of all past fires to map
high-risk areas and using metrics such as economic background to develop
insights on these patterns. These insights can help with performance
measurement as well as deciding where stations should be located. Data science
such as this can be equally applicable to the police and ambulance services. In each of these sectors, traffic mapping is vital since reaching the site of the issue in
the fastest time possible is key. Tools such as LUCA Transit (which analyzes over 7 billion daily events to provide
insights on traffic routing, volume and more) use Big Data to achieve this. You can read about some case studies here.
![]() |
| Figure 1 : The Nest Protect |
Don’t miss out on a single post. Subscribe to LUCA Data Speaks.