5 degree programs for becoming a Data Scientist

AI of Things    22 March, 2017
At LUCA, our Data Scientists are at the heart of what we do. Recruiting these valuable team members can be a challenge, though, because they are in such high demand. As more and more businesses realize the importance of making data-driven decisions, the need for data scientists is growing.

This demand means that pursuing a career in Data Science can be a good option if you get excited about Big Data and AI. In fact, Forbes named “Data Scientist” as the best job of 2016, with a median salary of $116,000 (USD) and a constant supply of open positions.

If you want to land a Data Scientist position, it’s highly likely that you’ll need an advanced degree. Up to 92% of all data scientists have an advanced degree (split pretty evenly between masters and doctoral degrees). While these degrees are not always specifically in Data Science, there are many relevant degree programs, focusing on everything from Business Analytics to Data Mining.

Here are five stellar programs to check out:

1. Carnegie Mellon in Pittsburg, PA, USA

Figure 2: Carnegie Mellon has a variety of programs for data-inclined students.
Carnegie Mellon offers several degrees for students looking at a career in data science. Their Masters of Computational Data Science focuses on giving students a strong foundation in quantitative science, design engineering and computer science. The Masters of Information Systems Management in Business Intelligence and Data Analytics degree combines analytics, strategy, IT and business management skills to train students in both the hard and soft skills necessary to be a successful data scientist. Both programs are full-time and 16 months long.

2. City, University of London in London, United Kingdom

Figure 3: City, University of London is a top choice for machine learning fans.
The MSc in Data Science at City, University of London is targeted towards students with a background in math but who may be early on in their careers. The program is 12 months long and trains students in the diverse skills needed for their field, with a strong emphasis on Machine Learning.

3. North Carolina State University in Raleigh, NC, USA

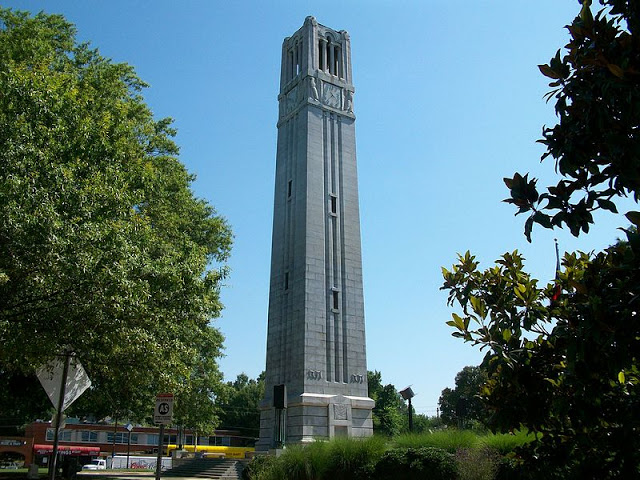
Figure 4: North Carolina State University’s program garners wide industry respect.
Although North Carolina State University does not have as much name recognition as other schools, it has a strong industry reputation. The Master of Science in Analytics is 10 months long and is a practical program, focused on giving students hands-on experience with the skills they will use in their field.

4. Stanford University in Palo Alto, CA, USA

Figure 5: Stanford’s location is in the heart of all the tech action.
Being located in the hub of Silicon Valley is a definite advantage for students in Stanford’s Master of Science in Statistics with an emphasis on Data Science. Students can develop strong connections to leading tech companies and often get a front-row seat to new technologies. This 2-year program is geared towards students who may want to pursue a Ph.D., so it is heavier in theory than other programs on this list.

5. Ludwig Maximilians University Munich in Munich, Germany

Figure 6: Ludwig Maximilians University Munich attracts students with top marks.
The Master of Data Science program at Ludwig Maximilians University Munich is widely respected in Germany and throughout Europe. Like most German schools, this program does not have tuition fees, but has rigorous background and academic requirements. The instruction language is in English and the program is 4 semesters long.
The number of schools offering Data Science-related programs is growing to keep up with student demand. This list is merely a starting point to get you started in your search for a data-driven career.

Poverty Insights in Guatemala using Big Data

AI of Things    16 March, 2017
No poverty” is the first of the U.N.’s 17 Sustainable Development Goals and it is closely linked with several other goals, including zero hunger, reduced inequality, and good health and well-being. Alleviating poverty, then, can have positive ramifications for several other development dimensions. Here at LUCA, we’re committed to doing what we can with our Big Data technology to address problems like poverty.
A recent study conducted by a team of World Bank researchers, including members from LUCA, found that mobile data can be a valuable tool for predicting poverty rates based on location, which will allow for more effective poverty alleviation strategies. This initial study was conducted in Guatemala and focused on five administrative regions, in order to determine if the study was effective on a smaller level before exploring possibilities to scale up. The study’s goal was to determine if using aggregated and anonymized call detail records (CDRs) would be an accurate predictor of geographical poverty characteristics.

Bringing location intelligence to poverty concentrations is important for countries like Guatemala, where, unfortunately, poverty is on the rise. According to World Bank statistics, 56% of the total population lived in poverty in 2000 and that number rose to almost 60% by the most recent estimates from 2014. But the overall figures, while important, cannot form the basis for an effective poverty alleviation strategy.

To determine more specific poverty information, the government of Guatemala conducts periodic surveys and censuses. These household-by-household surveys provide an accurate picture of poverty distribution. The downside, though, is that these traditional methods are expensive and time-consuming. For example, the most recent survey was conducted in 2014 and cost $2 million (USD) and 2 years to complete, and it only covered 11,500 households. Because of the high costs of time and money, these surveys are conducted at rather sporadic intervals.

Poverty patterns change frequently, so having updated information is key for strategically targeting poverty reduction efforts. Governments like Guatemala’s typically have less budget to conduct surveys, so they often have to base their aid planning on incomplete or out of date information. This results in poverty-related public expenditures that are, tragically, not able to accurately target those most in need.
The World Bank study using CDRs tries to discover if this data could be a potential supplement for the more expensive traditional surveys. By contrast, this CDR-based study cost approximately $100,000 (USD) to conduct, the majority of which went towards the fixed cost of developing the computer algorithm. Additional surveys will thus be significantly less expensive because the algorithm is already in place.

big data for social good, poverty
Figure 3: More accurate, updated data means poverty aid can be better targeted.

The study’s results are encouraging. Researchers concluded that CDRs can predict poverty distribution fairly accurately when measured against the collected data from recent surveys. Accuracy was higher in urban areas, where there are higher concentrations of poverty, due to the penetration of mobile phone usage.

big data for social good, poverty
Figure 4: Actual Poverty Rates for Municipalities of Study.
big data for social good, poverty
Figure 5: Modelled Poverty Rates differ in the Municipalities of Study.

These conclusions mean that CDR-based data collection can be used as a supplement to the more costly surveys to provide the Guatemalan government with updated, real-time poverty information. Currently, the CDR analysis does not fully match the accuracy of census data, but it is a strong complement. Additionally, researchers theorize that using a larger data set than the initial five regions used for this study will allow for greater accuracy and new possible applications of the data.

Enrique Frías, who works as one of our lead researchers in Telefónica and LUCA’s R&D department said:

“This study will help to implement and measure public policies in a very effective way, it has the potential of changing how to tackle and advance in the fight against poverty.”

big data for social good
Figure 4: Big Data can be a valuable tool in the fight against poverty.
The potential for more affordable solutions for addressing poverty is growing, whether through the use of Big Data like CDRs or through combining satellite imagery and Artificial Intelligence to map distribution. LUCA is excited by the possibility of using Big Data to more accurately target poverty efforts. Through our recently announced partnership with UNICEF’s Magic Box program and other Big Data for Social Good initiatives, we are encouraged at the progress that is being made to accomplish the goal of a world without poverty.

José Ignacio Guerra: “We’re playing a leading role in IoT scene in Latin America”

Beatriz Sanz Baños    15 March, 2017

The Telefónica R&D centre (TID in Spanish) in Chile is a benchmark for Internet of Things technologies. This is the only research complex in Latin America to bring together all the disciplines comprising IoT. In this regard, it develops innovative solutions for Smart Cities, Agriculture and Mining, the key areas in the region’s industry and economy. José Ignacio Guerra is the Communications Architect at the core and leads several projects and initiatives aimed at improving the adoption, penetration and consolidation of IoT technologies. In this interview, he is going to tell us about his experiences.

1.     The Telefónica R&D Centre in Chile is an International Centre of Excellence focused on research and development. Could you tell us a little more about the centre?

The Telefónica R&D Centre in Chile is the only Telefónica centre in the world that specialises in research, development and innovation in the technologies comprising Internet of Things, including those related to low-power networks and connectivity which are so essential for the development of the sector. This is a joint initiative undertaken by Telefónica and the Chilean government through CORFO, the agency responsible for supporting entrepreneurship, innovation and competitiveness in the country, and its programme to attract International Centres of Excellence.

We have two main objectives at TID Chile: the first is to become part of the new technology wave that is IoT by developing new products and/or services that can be part of Telefónica IoT catalogue in the short or middle term, not only in Chile but also internationally. The second is to promote the use of this kind of technology in the Chilean economy, where the strongest sectors are mining (Chile is the largest copper producer worldwide) and agriculture. We strongly believe that the IoT has a fantastic chance to meet historic challenges that technology has been unable to resolve so far.

2.     In your opinion, what are the most interesting projects being tackled at the centre?

We are entering a consolidation phase this year in which we aim to achieve prominence in industry after the first two years, during which we focussed on validating our proposition through proof of concepts in pilot scenarios in partnership with future customers of the three business verticals that define us (Agriculture, Mining and Cities). 

Three projects that we are working on together with Telefónica IoT Global particularly stand out in this consolidation phase:

  • Mobility Broker: A reusable solution for different mobility cases which is capable of using different data sources (in-house or third party) in a scalable way.
  • Reference Architecture: A platform that efficiently supports Big Data solution use cases using the physical Open Telefónica Cloud (OTC) infrastructure.
  • Open IoT Lab: An open LPWAN mobile technologies lab covered under the programme of the same name launched by the GSMA and aimed at promoting the rapid adoption of this kind of technology in Chile and Latam.

3.     Can you explain your role as Communications Architect to us? What is it like leading some of the most promising IoT experiences in Latin America?

As Communications Architect, I’m responsible for leading all projects involving research and development in IoT connectivity, starting with mass data acquisition from all kinds of sensors rolled out in multiple environments, then integrating these sensors in IoT communication devices, and concluding by sending this data to Internet platforms through some of the varied IoT connectivity technologies currently available. 

This is a very dynamic area that is constantly changing, which has allowed me to be at the forefront of the technology, mainly in connection with IoT connectivity networks (LPWA networks). The experience we’ve gained at TID Chile has given us significant visibility in the industry, which  gave me the chance to be invited to share this experience at the first LPWA network conference for North and South America, held in Dallas on 1st and 2nd November. 

4.     Talking about Latam, in your words, what role does the Centre play in Technological Development in Chile? And in Latin America?

We certainly play a key role in the adoption of this kind of technology in local industry and in Latin American industry as well. I would daresay that we are the only Research and Innovation Centre in Latin America to bring together all the disciplines comprising the IoT; this gives us an implicit responsibility in the adoption and subsequent penetration and consolidation of IoT on our continent.

5.     Can you tell us more about the areas of Agriculture, Mining and Smart Cities? Where is the most effort being made?

These three areas are the business verticals that have been our focus since starting the project; therefore, they define us as TID Chile, giving us an IoT vision with very close ties to industry. 

Mining and Agriculture are the two most important industries in Chile and Latin America, and we’re proposing solutions with an end-to-end IoT vision in both which depend on the acquisition of mass field data which is then processed in real time through IoT platforms developed at our centre. The platforms aim to transform the data into useful information for making important decisions. I have examples of this in two of our projects that are the closest to the production phase, which are based on prediction models that have led us to attain our first two industrial patents: an irrigation prediction solution for the agriculture industry, which is able to recommend irrigation schedules and periods through a mobile app based on soil moisture and weather data measured in real time; and an energy-efficient solution for mining which is able to recommend practices for more efficient energy consumption through a web app based on real-time data acquisition from industrial PLC networks.

Finally, one of our most interesting projects is with Smart Cities, which has given us our first customer, the development of an anonymous urban mobility platform (PUMA) capable of analysing city traffic by processing the network’s CDRs practically in real time.

6.     And what role does IoT play in these projects? Can you give us some examples?

IoT is a complex concept with different definitions used in the industry. One example of this is the multiple results that come up when searching for a definition on the Internet. We define IoT as all the technology that allows generated data to be processed, through the connection of any object to the Internet, in order to provide information that is useful  in making important decisions. This is a vision that involves multiple disciplines such as connectivity, platforms, application development, user experience, data analytics and business vision, and it only gives the user value when we are able to provide useful information for decision-making. This IoT vision is what defines us at TID Chile, and we’re committed to integrating it into all our projects.

7.     Is Chile’s industry adapting to an “IoT world”?

Yes, and proof of this is the visibility and prominence we have gained at the industry level over the course of these first two years. We need to keep in mind that Chilean and Latin American industry is characterised by a fairly conservative and traditional view, which makes it more complicated to incorporate innovative technological concepts that have not previously been validated. However, the future looks promising and we are convinced that 2017 is the year that the IoT will start to penetrate industry throughout the region.

8.     What are the main challenges of adopting a truly inclusive ecosystem with Internet of Things at the industrial level? Are there any sectors that are more advanced in this regard?

The conservativism I mentioned above is undoubtedly the biggest challenge, but we have found that by uniting the vision and drive of private industry with a more academic or research vision, this inertia can be broken and innovative and cutting-edge technology can be applied in traditionally closed environments such as mining, or those with less technology such as agriculture.

9.     Talking about LPWAs, what role do you believe they play in communications?

One of the keys to the massification of IoT solutions is the networks connecting all these “things” to the Internet. In the majority of cases, these networks are not traditional, such as mobile or WiFi networks, but rather new kinds of networks exclusively designed for IoT. LPWA is the acronym which encompasses all these connectivity technologies. The acronym comes from two key IoT concepts: the low power consumption of the devices that connect to these networks (Low Power) and the broad coverage that they can offer (Wide Area) compared to traditional mobile networks.

10.  How will the LPWA ecosystem work, taking into consideration licensed and unlicensed solutions? Where will they play a prominent role?

The business opportunity that IoT provides is so great and the scenarios in which LPWA networks are the only scalable option are so diverse that there is certainly opportunity for the entire LPWA ecosystem, both licensed and unlicensed. However, I think that unlicensed networks have a particularly promising scenario in Latin America due to the historical debt held by mobile network coverage in all the countries, a debt that will remain for licensed LPWA networks which perfectly matches the industrial scenarios that are very interesting for the IoT, such as mining and agriculture. This opportunity clearly depends on whether unlicensed LPWAs are able to take advantage of the one- to two-year window still remaining for operators to commercially offer standardised LPWA connectivity.

11.  Tell us about your experience in promoting the creation and consolidation of a local IoT HW development ecosystem and your responsibility in the TID’s IoT open innovation programme.

At TID Chile we strongly believe that promoting a development ecosystem is a key milestone in accelerating the adoption of IoT in industry, and we are certainly willing to shoulder the risks arising from this belief. We launched the first of four open IoT HW development challenges over a year ago, which are covered under our Open Innovation Programme that I have the privilege of leading. So far, this programme has sought to meet the twofold objective of resolving technological boundaries (particularly related to the cost of IoT devices or the lack thereof) that have prevented us from meeting certain interesting use cases, while at the same time promoting the creation of this essential local development ecosystem through agile projects in which selected entrepreneurs are supported with $10,000. The experience has been a resounding success so far: 52 projects have been received and seven of them selected, representing a total investment of close to $100,000 to date.

12.  What is your personal vision for Internet of Things in Latin America?

I’m convinced that Internet of Things is an unparalleled opportunity for Latin America, mainly for our continent’s most important industries, such as mining and agriculture. These scenarios, which have such specific and yet homogeneous conditions throughout our continent, are where the mass IoT which all the market analysts are talking about has the opportunity to become a reality.

13.  Who is playing a leading role in IoT scene in Latam?

We’re certainly playing a leading role in Chile, but we’re not alone. The opportunity offered by IoT isn’t a secret, and it has served as motivation for actors from very diverse technological niches in Latin America to start considering the possibility of participating. I think Sigfox in particular has been very active by making investments for network rollout through third parties in Colombia, Brazil and Mexico. This year, they should be joined by Argentina, where they have already officialized a network rollout agreement on last December, Chile and Perú.

4 times Big Data invaded the world of Fashion

AI of Things    15 March, 2017
The relationship between Big Data and Fashion stems back to 2013 when giants like ASOS and Gap started to use data to enhance their customer shopping experience – revolutionizing the way consumers buy garments online.


1. Chanel’s Data Centre

Let’s rewind to the Chanel SS17 show which saw the Grand Palais catwalk transformed into the “Chanel Data Centre”. Karl Lagerfeld (the brand’s creative director) is always one for a show, but this time he brought relevance to the world of technology even going as far as to create the Chanel logo with USB cables. 

Karl Lagerfeld with his tech fashion models.
Figure 1: Karl poses with his robot models showing off the latest Chanel tweed.

2. IBM Watson and Marchesa’s Cognitive Dress

One of the biggest events on the fashion calendar for the year is always the Met Gala, which always promises a star studded red carpet. In 2016, we saw Karolina Kurkova take to the red carpet with a “cognitive dress”. This was a collaboration between Marchesa x IBM with the aim of creating a dress that only little girls could have dreamt of before, but now has been made a reality through Big Data. 
The research that was provided by the IBM platform Watson giving the design team at Marchesa deep insights into consumer behaviour allowing them to have a greater understanding of the trends out there. This worked by feeding images of their old collections through the system which then assisted them in choosing new colour pathways and creative direction for the final dress. 
The lights installed on the dress made this process even more interactive as they were able to change colour according to social media reaction, showing an amazing visual representation of live polling. Not everyone can have the confidence of a supermodel to feature a live poll on their dress, so perhaps we should move on to something a little more accessible.

The IBM Watson Dress of Karolina Kurkova.
Figure 2: Karolina Kurkova lets Big Data invade the red carpet at the Met Gala 2016.

3. Google and H&M’s Coded Couture


Helping to take this trend from high fashion to more affordable high street brands, H&M’s digital division (Ivyrevel) are working in collaboration with Google to bring us “coded couture. This data-driven app will monitor your daily online activity and apply these findings to create the perfect dress for you. It takes into consideration your physical behaviour, the cool spots you always meet your friends for a coffee and where your night normally finishes – whether that’s an underground rave or a bottle of champagne on a roof top bar. Once all of the findings are recorded, they are then processed to take into consideration all factors that could effect the wearer. The main use of data is to enhance the creative process, not to take away creativity from the designer. So, what are you waiting for? Apparently the dress will only cost €100

4. Boltt’s data-driven trainers

Just to keep our more physically active readers engaged we decided to also take a look at Boltt. These smart shoes were showcased at Techcrunch’s TechDisrupt event in San Francisco in 2016, and will be launched alongside a virtual AI coach who gives runners real-time feedback to improve their running technique and fitness. The shoes feature an embedded stride sensor that allows Boltt to decode your performance in real time and track instantaneous speed, distance, calories, pace and much more. What we choose to wear to work out is becoming just as popular as what we wear on a daily basis (following the rising athleisure trend), so adding the depth of data analytics to our active wear we can reach a new era of style and performance.

Image of Boltt Trainers.
Figure 3: One example of the soon to be released trainers by Boltt.
Here at LUCA we hope to see the growth of fashion and Big Data partnerships, harnessing the power of data analytics in the creative process. When will Big Data take to the catwalk next? Keep an eye on our blog for the latest news. 

Axonix acquire mobile geolocation startup Statiq

AI of Things    14 March, 2017
This week, our programmatic trading platform, Axonix, has acquired British mobile geolocation data startup Statiq in our continued pursuit of data-driven business opportunities. The investment has been driven by Axonix’s scale and diversification strategy and will give Telefónica a wealth of data to better target consumers – bring even greater value to our corporate customers in LUCA.

Statiq launched in 2013 and has built a portfolio of partners ranging from demand side platforms to ad networks. Their solution processes “billions” of location data signals to identify the places people visit and subsequently build consumer profiles around them. The data can also tell advertisers whether a consumer visited a retail store after seeing a mobile ad.
Statiq: a geolocation data startup
Figure 1: Statiq is a British mobile geolocation data startup which we have acquired.
The expertise, skills and understanding of location data that the Statiq team bring with them is unparalleled,” said Axonix CEO, Simon Bailey. “Combining this with the unique and verified first party data sets will create a significantly superior and differentiated product set.”
Tim Finn, CEO of Statiq, added: “Location intelligence has become a critical capability for digital marketers across all channels. Location-based mobile advertising in particular is fast becoming a key competitive differentiator as mobile ad players enjoy the benefits of providing a highly personalised, relevant and timely user experience.”
Figure 2: Simon Bailey, CEO of Axonix, reflects on the acquisition.

“This type of location data is highly valued on exchanges – uniting Statiq’s data and analytics products with Axonix programmatic platform we are able to enrich the whole experience for brands and agencies.”


The acquisition also allows O2’s mobile marketing and insights provider, Weve, which is integrated with Axonix technology, to offer UK advertisers an enhanced and expanded location data solution. It brings together Statiq’s GPS-based footfall measurement, telco data, and insights from across O2’s 15,000 Wi-Fi hotspots and will provide advertisers with greater insights into audience behaviour and campaign performance at a granular level.
Statiq and Axonix will combine offices in London as well as maintaining offices in Barcelona and Kiev, continuing under their own independent brand.

p.p1 {margin: 0.0px 0.0px 0.0px 0.0px; font: 11.0px Calibri}
span.s1 {font-kerning: none}

Our HackForGood Roundup

AI of Things    14 March, 2017
HackForGood is all about encouraging people to come up with innovative ways to use data for social good. The fifth edition of Hack for Good took place at the Escuela Técnica Superior de Ingenieros de Telecomunicación at Universidad Politécnica de Madrid from Friday March 10 to Saturday 11. The event aims to cultivate young talent, encouraging this through active participation and a wide range of prizes and awards.

Our Chief Data Officer, Chema Alonso, gave an inspiring talk about his career, which started helping his father paint houses during his free time to being selected to join the board of Telefónica. Chema also discussed how it is important for Spanish universities to encourage the engineers of tomorrow to become technology makers, driving innovation as well as challenging themselves on a day to day basis in their degrees.

Participants HackforGood
Figure 1: Participants from Escuela Técnica Superior de Ingenieros de Telecomunicación
Hundreds of students took part in the event, tackling social challenges with technology such as creating an app to support blood donation and a solution to work against cyber bullying as well as developing a smart food app to optimize food usage. Some students even created an app which combat game addiction. Many fantastic projects were created and we were super impressed by the quality of the team pictured below, who used CARTO to visualize Telefónica mobility and consumer data in Colombia to detect poverty and the movement flow of the population of each munincipality.
LUCA winner team
Figure 2: One of the teams that participated in the LUCA Challenge
Students spent their weekend working hard to apply data for social good, working late into the hours of the night to meet the pressing deadline.  One team member, Andrés, who took part in the LUCA Challenge, said: “This is a perfect opportunity for us to apply our knowledge to have a social impact“.
HackforGood mannequin challenge
Figure 3: Participants even had time to do a #HackforGood mannequin challenge
Want to see what you missed out on here? Check out our roundup video below:

How Big Data helped Stuttgart improve commutes and tackle Climate Change

AI of Things    13 March, 2017
Here at LUCA, we are passionate about harnessing the power of data to tackle problems. Whether the problem is a global threat like climate change or a personal issue like a frustrating commute, LUCA tries to address these problems using mobile data through our Big Data for Social Good initiative. An inefficient public transport system connects to problems both on a global and personal level, so it is an ideal issue for us to address.

Big Data, Mobility Solutions, Big Data for Social Good
Figure 1: Improving Stuttgart’s Transit System Can Address Personal and Global Concerns
On a global level, the U.N. Sustainable Development Knowledge Platform attributes a quarter of all global greenhouse gas emissions to the transport sector. That pollution level is so serious that two of the United Nations’ seventeen Sustainable Development Goals involve improving public transport. Goal nine for industry, innovation and infrastructure, and goal eleven for sustainable cities and communities both include the need for sustainable public transport systems. Cities are increasingly looking at their transit systems to address issues such as pollution and cutting carbon emissions.

On a personal level, an efficient public transit system also has the benefit of improving citizen happiness through reducing commuter stress. Particularly if the commuter does not have any other options than public transit, an unreliable or overcrowded system can be frustrating. Recent studies have even shown that a bad commute in the morning can negatively impact productivity for the rest of the day, averaging around a 10% drop in productivity. So improving commutes can have multiple levels of returns.

Big Data, Mobility Solutions, UN Sustainable Development
Figure 2: The U.N. SDGs involve improving public transit systems
But a city’s ability to improve its system is only as good as the information it uses to make those improvements. We have seen how the pilot project in the city of Nuremberg tackles the problem of air pollution from commuter traffic by using data analysis. Similarly, Stuttgart is using data to address the issue of its overburdened public transit system.
Through Telefónica NEXT’s partnership with Fraunhofer Institute for Industrial Engineering (IAO), we are using the current transportation behavior of Stuttgart residents to get a detailed analysis of current use patterns.

Big Data, Mobility Solutions, Big Data for Social Good
Figure 3: Stuttgart is Seeking to Address Overcrowded Public Transport Systems
Currently, most cities base their transport plans on data gathered through surveys. These surveys are samples of the whole commuter group that are conducted every few years. The problem with relying solely on these surveys, though, is that commuter behavior can drastically change in between survey instances, and they do not capture the whole picture of a commuter group. The surveys can also be expensive and time-consuming.
This is what using mobile network data solutions directly addresses. Because this data is tied to user cell phone positioning, it provides real-time data. It also expands the sample of commuters included in the survey to anyone who is a Telefónica customer in Germany. The available data is therefore much larger. It’s also a lot less time consuming and expensive to gather this information, because it uses existing systems.
Another neat benefit of tracking commuter behavior with mobile data is the ability to see different journey patterns. For instance, if a commuter uses both a train and a bus as part of their commute, this whole journey can be seen as one complete commute. Normal survey data is unable to precisely connect these two legs of the journey and treats them as separate trips. This big-picture view of commuter behavior can help Stuttgart city planners to identify previously unnoticed commuter frustration points. They can also address current needs along the whole journey, rather than segmented problems.

Big Data, Big Data for Social Good, Mobility Solutions
Figure 4: Potential Commuter Journey Path
In addition to supporting daily commuters, a public transit system needs to support occasional traffic influx from special events. Using mobile data could also help Stuttgart planners to examine one-time events and other external influencing factors like severe weather. For example, analyzing data from the Cannstatter Spring Festival and the Stuttgarter Weindorf can reveal important behavior patterns. Transportation authorities can then plan better, as well as adjust the plan in the midst of events to meet new needs as they arise thanks to real-time data.
Improved commuter behavior data will help Stuttgart and other cities have a better picture of how their citizens actually use the transit system. With this data, improvements and expansions to the system are more likely to address current commuter needs. Through this, LUCA can help commuters have a more reliable, less stressful commute while also helping the city to improve its infrastructure and reduce transport emissions.
  

96

Normal
0

false
false
false

EN-US
ZH-CN
AR-SA

/* Style Definitions */
table.MsoNormalTable
{mso-style-name:”Table Normal”;
mso-tstyle-rowband-size:0;
mso-tstyle-colband-size:0;
mso-style-noshow:yes;
mso-style-priority:99;
mso-style-parent:””;
mso-padding-alt:0in 5.4pt 0in 5.4pt;
mso-para-margin:0in;
mso-para-margin-bottom:.0001pt;
mso-pagination:widow-orphan;
font-size:12.0pt;
font-family:Calibri;
mso-ascii-font-family:Calibri;
mso-ascii-theme-font:minor-latin;
mso-hansi-font-family:Calibri;
mso-hansi-theme-font:minor-latin;}

LUCA Tourism at the Mexico Balloon Festival

AI of Things    10 March, 2017
Each year, the  Festival Internacional del Globo (FIG), brings together over 200 hot air balloons that fill the sky above the ‘Parque Metropolitano in León, Guanajuato, in what is an incredible spectacle. The event is known around the world and over 500 million people come to Mexico year after year. At the festival, hundreds of balloons fly for four days of colour-filled skies, incredible spectacles, concerts and activities for the whole family. Furthermore, the event takes place is an amazing natural environment within an ecological zone, which results in an incomparable setting that is the focus of millions of photos around the world.

The action begins in the early morning when 200 hot air balloons start to slowly rise up whilst pilots and crew work tirelessly on the pre-flight checks. Minutes later, the airfield turns into a festival of colours and designs that dance with the wind.

This event was the focal point of one of our LUCA Tourism studies, in 2016. Using our technology of mobile data insights, the project aimed to understand the movement, profile, and engagement of tourists in the region of León during the ‘Festival del Globo’, that took place between the 18th and 21st of November in 2016.

The Big Data and Advertising team at Telefónica Mexico, along with LUCA experts, carried out a study of the visitors to the event that included metrics such as the point of origin of the tourists, the identification of the most-visited zones of León and the segmentation by age, gender, social class and profile, including data about the mobility of the tourists by time of day.

Understanding the profiles of the attendees to this event, as knowing where they are from and who they are, has allowed the local government of León to evaluate the efficiency of the festival and to direct marketing and advertising efforts. This year we will see if their backing of innovation and a data-driven strategy will lead to more visits to the event so that is is more profitable for the city.

The 6 data-driven pioneers of politics

AI of Things    9 March, 2017
Data is starting to change the way we run our world, and businesses have tended to lead the adoption and application of Big Data technology. Nevertheless, there are some areas where it has been slightly harder to start the data-driven revolution, and politics is a key example. We’ve seen examples of data-driven election campaigns, with Obama becoming a pioneer when he ran for Presidency in 2008, yet what we’re actually referring to is the use of data to drive decision-making in governments.

So what about using data to decide economic, education, transport and energy policies? For now, only a few more forward-thinking local governments around the world have started to introduce data in this process. Examples such as Los Angeles, New York, London and Amsterdam have even created specific management positions to accelerate the transformation towards smart data-driven cities. We decided to take a look at who these digital leaders are, highlighting six pioneers who are trailblazing in the world of data in politics:


1. Lilian Coral, LA Chief Data Officer 


LA was one the of first cities to create the Chief Data Officer position, which was first held by Abhi Nemani. A year later he was substituted by Lilian P. Coral, “native of Colombia, product of Los Angeles”, she claims on her Twitter account. LA has taken the initiative of being shaped by data due to the persistence of Mayor Garcetti. In LA’s Open Data website you can check out some of the amazing projects they have been working on such as releasing the Mayor’s budget on the Open Data App, the LA Sustainability Plan or even a visualization of where Angelenos are getting married.


2. Andrew Collinge, Assistant Director of Intelligence at GLA


London doesn’t fall behind when it comes to data transformation. More than 8.6 million people live in London, most of whom suffer very long commutes from their homes to work. Andrew Collinge is responsible for dealing with such a problematic issue (not just using Big Data for travel amongst other problems), as the assistant director of intelligence at the Greater London Authority (GLA). Under his leadership, London has opened up access to its data and many initiatives have been created to make London a smarter more efficient city, with initiatives such as Citymapper.


3. Ger Baron, Chief Technology Officer for the City of Amsterdam


Normal
0

21

false
false
false

ES-TRAD
JA
X-NONE

/* Style Definitions */
table.MsoNormalTable
{mso-style-name:”Tabla normal”;
mso-tstyle-rowband-size:0;
mso-tstyle-colband-size:0;
mso-style-noshow:yes;
mso-style-priority:99;
mso-style-parent:””;
mso-padding-alt:0cm 5.4pt 0cm 5.4pt;
mso-para-margin:0cm;
mso-para-margin-bottom:.0001pt;
mso-pagination:widow-orphan;
font-size:12.0pt;
font-family:Cambria;
mso-ascii-font-family:Cambria;
mso-ascii-theme-font:minor-latin;
mso-hansi-font-family:Cambria;
mso-hansi-theme-font:minor-latin;
mso-ansi-language:ES-TRAD;}

Ger Baron, Chief Technology Officer for the City of Amsterdam, is a key player when it comes to using data to evolve and optimize our cities. He
has been involved in the smart city movement since 2007, when he started the
Amsterdam Smart City project. This innovation platform in Amsterdam brings
startups together to help the government develop new ideas for the city. The
Netherlands holds the 7th position globally in the Open Data Barometer, which measures how advanced Open Data initiatives are in different countries.

Ger Baron, Chief Technology Officer for the City of Amsterdam
Figure 3: Ger Baron has led the transformations of Amsterdam into one of the most connected cities in the world.


4. Amen Ra Mashariki, Chief Analytics Officer for New York


In the city that never sleeps, data doesn’t either thanks to work from people like Amen Ra Mashariki, Chief Analytics Officer for New York. In the Open Data 2016 progress report, it stated that in only one year the Open Data Portal had 5 million views, 1500 datasets and 2000 user-created views based on city datasets. At only 41 years of age, Amen Ra has also worked for the Whitehouse, Motorola and the John Hopkins Applied Physics Lab as a computer scientist.
Amen Ra Mashariki, Chief Analytics Officer for New York
Figure 4: Amen Ra Mashariki has the mission to open all  of New York’s data by 2018.


5. Martin O’Malley, Governor of Maryland from 2007 to 2015


Until this point we have focused on Chief Data Officers, but what about a Mayor whose daily work is run by data and analytics? Martin O’Malley, the ex-governor of Maryland and previously a Presidency runner does just that. He launched StateStat, now called the Governor’s Office of Performance Improvement, which is a tool that measures Maryland’s Government management improvement in a truly data-driven way.

Martin O'Malley, Governor of Maryland from 2007 to 2015
Figure 5: Martin O’Malley was the Mayor of Maryland from 2007 to 2015.


6. Claude Migisha K and Stephen Abbott Pugh


Normal
0

21

false
false
false

ES-TRAD
JA
X-NONE

/* Style Definitions */
table.MsoNormalTable
{mso-style-name:”Tabla normal”;
mso-tstyle-rowband-size:0;
mso-tstyle-colband-size:0;
mso-style-noshow:yes;
mso-style-priority:99;
mso-style-parent:””;
mso-padding-alt:0cm 5.4pt 0cm 5.4pt;
mso-para-margin:0cm;
mso-para-margin-bottom:.0001pt;
mso-pagination:widow-orphan;
font-size:12.0pt;
font-family:Cambria;
mso-ascii-font-family:Cambria;
mso-ascii-theme-font:minor-latin;
mso-hansi-font-family:Cambria;
mso-hansi-theme-font:minor-latin;
mso-ansi-language:ES-TRAD;}

Moving away from Europe and the US, we also decided to highlight two true change makers from Africa.
According to the Global Open Data Index, Rwanda climbed 30 places in the 2015 ranking, now sitting in 44th place. Claude Migisha and Stephen Abbott Pugh have been true catalysts in Rwanda’s data-driven revolution. This pair founded Tumenye, a tech organization building tools for open
data in Rwanda. They have been working on a project to build an access information website collaborating to help Rwanda accelerate its digital transformation and become the most data-driven country in Africa.

Rwanda, the most data-driven country in Africa
Figure 6: Rwanda is the most data-driven country in Africa

Here at LUCA, we believe that Big Data and Artificial Intelligence will play a pivotal role in the way we run our cities and countries – and political innovators such as the individuals above are crucial to accelerate the journey towards data-driven solutions, evangelizing and exploiting the great value of data in a time where too many are starting to doubt it

Our top 5 LUCA events in March

AI of Things    8 March, 2017
February has come to an end, and it’s been a busy month in terms of events at LUCA. We organized our second webinar, which you can check out here and our presence in MWC was a success, with hundreds of people visiting our stand. March has now arrived and here are some events that we recommend:

1. 1st Big Data Talent Meetup, Madrid

To kick off March, Big Data lovers can attend the first Big Data Talent meetup, which will take place on the March 9 here in Madrid. This event will foster interaction between companies and professionals from across the sector to encourage future employment opportunities. Antonio Guzman will be leading the event, as 4th Platform Director in Telefónica, giving a talk about our CDO programme and our Big Data challenge for universities. A combination of panels and lectures led by industry professionals will allow for a high quality event.


2. 5th edition of HackforGood, Madrid

 
HackforGood is back again and in its 5th edition from March 9 to 11, in Madrid and many other locations across Spain. This event, promoted by Telefónica, allows hundreds of hackers to create challenges and develop solutions to build a better world. In addition, Chema Alonso, CDO of Telefónica, will give a keynote to all attending the event. Participation is free, the only thing you need to do is fill in this application. If you want to know everything about our LUCA challenge and prizes, check out this post.

Figure 2: Some of the participants of the 4th edition of HackforGood.

3. European Energy Digital Summit, Berlin

 
Today starts the European Energy Digital Summit, which is taking place in Berlin the 8th and 9th of March. This year the event is expanding rapidly, including a customer Data Analytics and Energy Roundtable. This unique event allows attendees to build relationships and network, expanding their knowledge of a complex market and exploring new possibilities for the future. Our director of Big Data for Social Good, Richard Benjamins, will be talking about Big Data as key part of the digital transformation journey.

Figure 3: European Energy Digital Summit, Berlin.


4. Big Data and the Health sector, Madrid

 
At the end of March, we’ll be attending a thought-provoking event organized by the Spanish Ministry of Health. During the conference, various experts will analyze where is the real value of Big Data in the public health system and what are the possible legal barriers that Big Data will have to face in the future. The event will take place on the March 21 in the Ernest Lluch building. To attend the event simply fill in the following application and save the date. This event will be held in Spanish.

Figure 4: Big Data and Public Health.


5. LUCA Talk 3: Big Data as a differentiator in cycling; online

 
Don’t forget to save the data in your diary for the next LUCA webinar in March. The last week of this month (date TBC) we’ll be focusing on the use of Big Data in cycling. The LUCA team recently used the data generated by the Movistar cycling team to optimize their performance, by creating an analytical tool adapted using the latest statistical models and Machine Learning techniques. Don’t miss this month’s webinar and discover more about the power of taking a data-driven approach to sport.

Want to know all about our latest events? Keep an eye on the events section of our website.