IoT Trends for 2017, users in the spotlight

Beatriz Sanz Baños    22 December, 2016

2016 has been the year when connectivity started to change driven by LPWA technologies and Personal IoT gains traction as a scenario where users are the main players. But other interesting technologies such as BlockChain, Virtual/Augmented Reality and Machine Learning are also emerging and growing quickly in the ecosystem. These are the trends that are setting the stage for 2017.

IoT Processes Technologies

Big Data analytics transforms everything

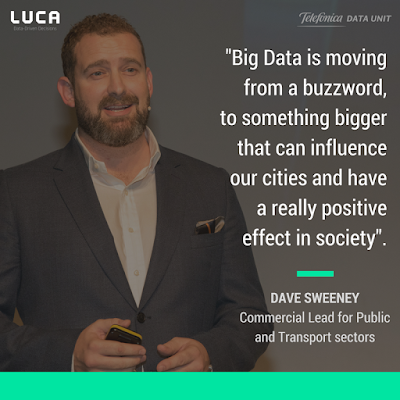
IoT means a huge amount of data and capturing, analysing and using those massive data sets is a real challenge. Big Data was born as a concept due to the inability to acquire, curate and analyse certain amounts of data within an acceptable time range. That gives us an idea of how broad Big Data could be. Actually, Big Data is a cross-cutting theme related to almost every field of IT. Shopping, healthcare, finance, information…IoT is immersed in and part of this ocean that is Big Data. From sensor data to information received from users, the range of information with which it works is intricately interrelated. Analytical algorithms and computing play a key role in making the information valuable and practical by filtering and organizing it. Scalability [1] is one of the biggest challenges on the horizon. But even with these difficulties, Big Data analytics are overwhelmingly utilized in global development projects [2], such as LUCA, the new Big Data services unit of Telefónica which enables its corporate clients to understand their data and encourages a transparent and responsible use of it by bringing companies closer to their customers and allowing them to optimize their entire operation. Step by step, all the information in the network is merging into Big Data, transforming everything.

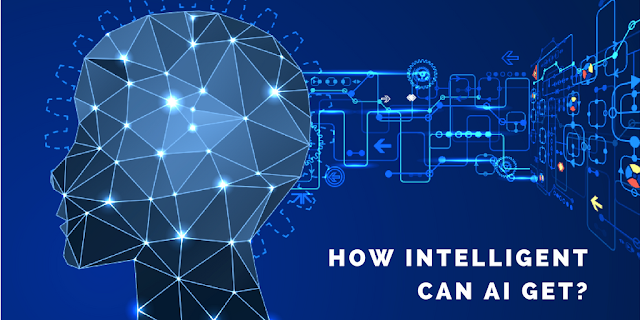
Machine learning, true innovation in AI

Thanks to Machine learning programming, computers gain the ability to learn new ways to face new challenges more efficiently, using resources in smarter ways or even learning new tasks to complete. As the size and complexity of the data collected grows, there is an increasing need to go beyond efficiency improvements and automation regarding IoT. Machine learning is the process of automating the analytical data model and is a first step towards artificial intelligence applied to IoT. Likewise, because of its implications, machine learning is employed in a wide range of computing tasks where designing and programming explicit algorithms is unfeasible. Chatbots, for example, are a perfect example of machine learning. Chatbots are typically used in dialog systems for practical purposes: customer service, assistance or information acquisition. They are programmed to be richer in their responses, more efficient and more effective completing their tasks. The deeper is their interaction with the users, the better the results they are able to give in return. As an evolving technology, Natural Language Processing (or NLP) is a promising part of machine learning that assures more natural, fluent and efficient communication. IoT could harness this kind of technology to improve human-to-machine interaction, making it more sophisticated as well as more valuable. This important bridge will prove to be crucial.

The role of BlockChain in IoT

A BlockChain is a distributed database made up of blocks or strings designed to prevent modifications once data has been published [3]. The purpose is to store a continuously growing list of records which cannot be modified or revised. This has a number of very important implications in transaction systems and legal issues, as well as technological implications. According to some experts in the industry, BlockChain technology is the missing link to resolve scalability, privacy and reliability concerns in the IoT. According to Cisco, 50 billion devices are due to come online by 2020 [4]. How exactly can we track and manage billions of connected devices store the metadata that these devices produce and do it all reliably and securely? Blockchain is intended to address this problem by offering solutions that allow users a realistic, progressive and rapid IoT adoption. This technology can be used in tracking, enabling transactions and coordination between devices to be processed. This means significant savings to IoT industry manufacturers. It is an important decentralized approach that would eliminate single points of failure, creating a more resilient ecosystem for devices to run on, while also making consumer data more private. This will open new possible scenarios where there have never been transactions before.

Security on Internet of Things

There is no way to talk about the IoT without addressing one of the most sensitive issues: security. Cybersecurity has always been an especially crucial concern on the Internet. It generates a great deal of interest among users and major concerns among entrepreneurs, and security experts work day and night to ensure that network is safe for both of them. Recent attacks on various companies and services that have compromised users’ security by making sensitive information available to hackers demonstrate that security is more important than ever in IoT. According to some experts’ predictions, by 2017 the most critical vulnerabilities will continue to exist on the network. In fact, the industrial IoT will also become more vulnerable to cyberattacks in 2017 as its informational and operational technologies continue to converge [5]. At Telefónica, we care about these matters. We work hard with other security experts, such as Symantec, to guarantee protection. Mobile devices will emerge as an even greater personal and corporate security concern. But at the same time, industry must react to that concern by investing more time, more resources and more money into protecting our data. This involves changing paradigms and technologies, reinforcing those we already have and learning more about cybercriminals. Initiatives in IoT security like Trusted Public Key Infrastructure or Security Monitoring like Vamps and CyberThreats, examples of solutions that Telefónica provides, would help to assure this.

IoT Connectivity Technologies

LPWA expansion to harness the growing IoT

In 2015, we witnessed LPWA, as a group of technologies specialized for interconnecting devices with low-bandwidth connectivity, focusing on range and power efficiency, finally became a mature ecosystem. In 2016, its use in telecommunications has marked the expansion of these technologies. In 2017, LPWA will serve as a core support in the expansion of the IoT solutions. A “low power wide area” network is wireless network technology used to interconnect devices with low-bandwidth, focusing on long ranges and low power consumption rates. This means a wider range for M2M and IoT applications, both of which are constantly constrained by budgets, leading to better options for industrial and commercial applications. Hence, LPWA is being used for Smart Cities and buildings, industrial applications and transportation. But those are not the only areas suitable for harnessing the growth of the IoT. According to one analysis [6], the LPWA market will grow at a “compound annual growth rate”, or CAGR, of 90% between 2017 and 2022. Starting this coming year, the low cost of new chipsets designed for this kind of technologies would bring the massification of IoT. Millions of devices connected is an essential part that makes IoT what it is.

Comprehensive Smart Cities

The future of urbanism lies in the Smart Cities, places where infrastructures will provide an adequate standard of living. Smart cities are the flagships of sustainable solutions, responsiveness and efficient time management. The IoT is key in this conceptualization of everything connected and every single technology working together to improve the life of citizens, or Netizens (from Internet + Citizens [7]). These natural inhabitants of both, the web and Smart Cities, are actively involved in Internet projects, online communities and social improvements associated with the Internet. Examples such as the FIWARE community [8] shows what we can expect from an adequate definition of Smart Cities. This is an “independent open community with the will to build an open sustainable ecosystem around public, royalty-free and implementation-driven software platform standards that will ease the development of new Smart Applications in multiple sectors”. The FIWARE ecosystem is intended to set a standard in smart applications for Smart Cities, laying the groundwork for quick and efficient development.

Connected assets and valuable tracking

Asset monitoring is a subject which has developed considerably in recent years. While barcodes and RFID tags marked asset tracking, which is currently immersed in IoT, connected tracking is much more efficient, allowing for real-time monitoring and many more features. We can not only trace a product but specific information can now be obtained from different sensors. For example, thanks to a wide variety of add-ons to monitor temperature, humidity or similar parameters, we can achieve real-time control of any kind of assets with additional value added functionalities. There are endless possibilities, from quality control to ensuring the conditions or safety of our assets just at hand. Technologies as the Telefónica multi-sensory geolocation solution, showed at the past MWC, in Barcelona, would provide users with the best indoor location. A successful example is GTX. This company developed a system that enables relatives and caregivers to easily bring their patients back home thanks to the integration of positioning and IoT communication. From the industrial point of view, these solutions also offer a vital amount of valuable information when making market decisions, usability improvements or user preferences, among many other things.

IoT Trends in Consumer Products

Connected cars, evolved driving

Autonomous cars are in the future of more and more automotive companies. These vehicles mean a leap forward for the driving experience. But for such a leap to become a reality, vehicles must be connected to the network. As the IoT is reaching the automotive industry, we can find more and more interconnections between devices and our vehicles. With cars capable of getting information from the Internet, the IoT will play an essential role in connected cars. For example working with algorithms in real time to avoid collisions, thus improving road safety, will be a crucial part of autonomous cars implementation in society; also, users will take advantage of IoT getting driving maps with points of interest or keeping them connected while driving. But much remains to be developed. Currently, the European Commission is continuing its work on a draft law to cover the existence and legal scope of all the nuances related to autonomous driving [9]. But a Smart City cannot be understood without cars connected to the network and the vast amount of information that this entails. These vehicles will be a part of its essential fabric, and next year we will begin to see the dawn of these cars.

Virtual, Augmented and Merged Realities

From a certain vantage point, virtual reality and IoT are two of the most important technologies from the last decade. In the first half of 2016 alone, an estimated $1.1 billion was invested in virtual reality [10]. In business and industry, AR can bring several advantages in maintenance of heavy machinery, helping in complicated assignments, or keeping a detailed and visual task list in real time. Also, it will allow better monitoring of work and workers, as well as trace delivery orders and their completion in a glance. This make the work flow easier, quicker and more efficient. The heavy machines manufacturer, Caterpillar, uses several IoT elements like sensors in the machinery, Big Data and a cloud backend to deliver a full-blown system with AR. This provides interesting solutions as several interfaces, operational and technical assistance and, also, asset management due to an AR device like a mobile phone or special glasses. When we talk about the IoT plus augmented reality or virtual reality, one concept is inevitable: “telepresence”, the fact of being there without being there, or being far away. This virtual presence is beginning to be exploited with keener interest every day, and it plays a crucial role in Smart Cities, where Netizens will be able to access more services from anywhere. The user’s intimate interaction with the world created under the premises of virtual reality signals an advance in social interactions as well as interactions with the network. It is still too early to see how the implementation of both technological ecosystems will develop, but their future is very promising. And next year we will begin to see what they are capable of.

Your own Internet of Things

IoT sets the stage for the evolution from “user” to “Netizen”. Internet of Things is both a driving force and a tool that is spearheading a change, in which people will go from accessing network services to being truly connected. Areas like personal medicine, applications and wearables, instant access to cloud services, our own “domotic” relationship with a smart home, autonomous car or Smart City… all of them are unavoidable individual facts, expressions of personal IoT that will guide the evolution of the ecosystem towards a more practical and adapted reality. Nowadays, health is already benefiting from personal IoT, but we foresee other personal IoT scenarios beyond medicine, such as wellness, lifestyle and peace of mind, with strong user interactions. As said before, we are already experiencing some of the advantages of personal IoT. But in the forthcoming years, we will see it fusing rapidly and becoming a natural part of our day-to-day lifestyle.

Citations

[1] “Clouds for Scalable Big Data Analytics”, Talia, D. Nov 30, 2016.

[2] “Harnessing the Internet of Things for Global Development”, Cisco. Nov 30, 2016.

[3] “Bitcoin: A Peer-to-Peer Electronic Cash System”, Nakamoto, S. Nov 30, 2016.

[4] “The Internet of Things How the Next Evolution of the Internet Is Changing Everything”, Evans, D., CISCO. Nov 30, 2016.

[5] “What Lies Ahead? Cybersecurity Predictions for 2017.” Chain Storage Age. Nov 30, 2016.

[6] “Low Power Wide Area Network Market Report 2016-2022 | Infoholic Research.” Nov 30, 2016.

[7] “CMC Magazine: Call for Articles on Netizen” 1996.

[8] “FIWARE.” Nov 30, 2016.

[9] “Automated vehicles in the EU”, EU Parliament, Nov 30, 2016.

[10] “AR/VR Investment Hits $1.1 Billion Already in 2016” Digi-Capital. Nov 30, 2016.

The refugee crisis and Syrian Civil War; a humanitarian issue reflected through data

AI of Things    22 December, 2016
When we finish the year we always look to the past to weigh up the good and the bad moments of the year (trying to make the most of 2016). Unfortunately, there are some places in the world where it’s difficult to find the good news. Syria being one of those places; dealing with a bloody civil war lasting for five years with an uncertain future. The Syrian conflict has seen tens of thousands killed, hundreds of thousands injured and millions who have been forced to abandon their homes.

The holidays are coming and we can’t wait to be able to spend them in our homes with our family and friends. For this reason, it seemed fitting for us to use this data to remember the number of families who have been separated and left without a home making them a refugee in a foreign country. We also want to recognise the solidarity of those countries who are receiving the fleeing population from Syria and make a call for action from states to multiply their efforts to give a dignified new life to these people.
 
To give yourself an idea of the magnitude of the impact of the Syrian War in terms of displaced people, we recommend that you look into the UNHCR data portal.
 
Syria Regional Refugee Response
Figure 1: UNHCR Portal
 
 
The United Nations Agency for Refugees has given an updated dataset with the number of refugees per country, also including demographic information like age and gender, financial needs and agencies which are aiding the situation in each country.
 
We can quickly confirm that since the start of the conflict the number of refugees has rose to 4,837,248 people who have had to give up on Syria through vulnerable conditions, 45% of those affected are under the age of 18. It is estimated that another 6 million people have also lost their home but have stayed in the country. According to UNHCR data, those who have managed to flee mainly are directed to Turkey (2,790,767), Lebanon (1,017,433), Jordan (655,675), Iraq (228,894) and Egypt (115,204). In the second figure we can assess the development of the number of refugees who left Syria and moved towards other regions. At the end of 2014 Turkey was the country which had received the most refugees. It should also be noted that since the beginning of 2016 the total number of refugees has varied very little.
 
Figure 2: Time evolution of the number of refugees received per country
 
Whilst Turkey is the country with the most number of displaced refugees, we are dealing with a country that is large in terms of area as well as population (less than 80 million inhabitants). Its per capita income (the largest among these countries) is around $9125.
 
We thought it would be interesting to reorder the countries with relevance relating to the size of their population and their per capita income, both allowing us to determine their global presence. The World Bank is the source for historic data like this, giving us access to this analysis. Figure 3 was created by using this information to create the time evolution giving us a new variable: the percentage of refugees directly correlated with the total population of the country. We can note that with relation to their size Lebanon and Jordan both made more significant efforts than Turkey. In 2014, Lebanon received 21% of refugees in relation to its population.

Nevertheless for the past two years they have in effect plateaued and Lebanon’s intake has actually decreased, and Jordan’s hasn’t increased. Turkey on the other hand has practically doubled its ratio in 2 years although it is still less significant than that of Lebanon and Jordan.
 
Figure 3: Relative percentage of refugees against the number of inhabitants of the destination country.
 
 
We notice the effect even more when we use animated graph to show the results (Figure 4 generated with Google Charts). The pace of the countries going up the diagonal line shows the absolute and relative increase relating to their population.
 
Figure 4: Yearly evolution of the total number of refugee´s vs the relative population of each country.
 
 
Furthermore, there is a shared feeling also expressed by the Spanish Commission for RefugeeAid that the international reaction to the conflict hasn’t been as effective in ending this situation. Despite the UN Security Council having passed three agreements (2139, 2165, 2191) that are urging states to help protect refugees and aid the ending of the civil war we are still in a state of crisis.
 
This fact is backed up by the open data that we can find relating to the refugee shelter that is provided by countries outside of the conflict zone. With this fact we have taken the data set (resettlement statistics) from UNHCR databases and downloaded from data.world. The total number of sheltered refugees dating from March 2016 was 130955, only just 2.7% of the total number of people forced to leave Syria. The countries that are most openly welcoming refugees are Germany, Brazil and the U.K. 
 
 
Figure 5: Country ranking varied depending on their level of shelter provided for refugees. (March 2016, UNHCR).
 
This is where our insight stops, however, we will aim to keep raising awareness with open information about this situation. The LUCA team hope that the magnitude of the civil war will plateau in 2017 and we hope to avoid having to report more figures about such a heart breaking atrocity.   

Can machines think? Or are humans machines?

Richard Benjamins    20 December, 2016
This is the last in a series of three post about some fundamental notions of AI. The objective of these series of three posts is to equip readers with sufficient understanding of where AI comes from, so they can have their own criterion when reading about the hype of AI. If you missed any of the two previous posts, you can read the first one about what Artificial Intelligence is here, and the second one on how “intelligent” can Artificial Intelligence get, here.

This dimension for understanding AI refers to how a computer program reaches its conclusion. Symbolic AISymbolic vs non-symbolic AIrefers to the fact that all steps are based on “symbolic”human-readable representations of the problems which use logic and searchto solve problems. Expert Systems are a typical example of symbolic AIas the knowledge is encoded in IF-THEN rules which are understandable bypeople. NLP systems which use grammars to parse language are also symbolic AI systems. Here the symbolic representation is the grammar ofthe language.The main advantage of symbolic AI is that the reasoning process canbe understand by people, which is a very important factor for takingimportant decisions. A symbolic AI program can explain why a certainconclusion is reached and what the intermediate reasoning steps havebeen. This is key for using AI systems that give advice on medicaldiagnosis; if doctors cannot understand why an AI system comes to its conclusion, it is harder for them to accept the advice.

Non-symbolic AI systems do nomanipulate a symbolic representation to find solutions to problems.Instead, they perform calculations according to some principles which havedemostrated their capability to solve problems without exactly understanding howto arrive at their solutions. Examples include genetic algorithms,neural networks and deep learning. The origin of non-symbolic AI comesfrom the attempt to mimic the workings of the human brain; a complexnetwork of highly interconnected cells whose electrical signal flowsdecide how we, humans, behave. Figure 2 illustrates the difference between a symbolic and non-symbolic representation of an apple. Obviously, the symbolic representation is easy to understand by humans, whereas the symbolic representation isn’t.
Symbolic and non-symbolic representation
Figure 2: A symbolic and non-symbolic representation of an apple (source http://web.media.mit.edu/~minsky/papers/SymbolicVs.Connectionist.html).
Today, non-symbolic AI,through deep learning and other machines learning algorithms, isachieving very promising results, championed by IBM’s Watson, Google’swork on automatic translation (which has no understanding of thelanguage itself, it “just” looks at co-occurring patterns), Facebook’salgorithm for face recognition, self-driving cars, and the popularity ofdeep learning. The main disadvantage of non-symbolic AI systems is thatno “normal” person can understand how those systems come to their conclusions oractions, or take their decisions. See for example Figure 2: in the left part we can understand easily why something is an apple, but looking at the right part, we cannot easily understand why the system concludes that it’s an apple. When non-symbolic (aka connectionist) systems are applied tocritical tasks such as medical diagnosis, self-driving cars, legaldecisions, etc, understanding why they come to a certain conclusionthrough a human-understandable explanation is very important. In the end, in thereal world, somebody needs to be accountable or liable for the decisionstaken. But when an AI program takes a decision and no-one understandswhy, then our society has an issue (see FATML, an initiative that investigates Fairness, Accountability, and Transparency in Machine Learning).Probably the most powerful AI systems will come from a combination of both approaches.

The final question: Can machines think? Are humans machine?

It isnow clear that machines certainly can perform complex tasks that wouldrequire “thinking” if performed by people. But can computers haveconsciousness? Can they have, feel or express emotions? Or, are we,people, machines? After all our bodies and brains are based on a verycomplex “machinery” of mechanical, physical and chemical processes, thatso far, nobody has fully understood. There is a research field called”computational emotions” which tries to build programs that are able toexpress emotions. But maybe expressing emotions is different than feelingthem? (See Intentional Stance in this post).
Computers and emotions
Figure 3: Can computers express of feel emotions?
Another critical issue for the final question is whether machines can have consciousness. This is an even trickier question than whether machines can think. I will leave you with this MIT Technology Review interview with Christof Koch about “What It Will Take for Computers to Be Conscious”, where he says: “Consciousness is a property of complex systems that have a particular “cause-effect” repertoire. They have a particular way of interacting with the world, such as the brain does, or in principle, such as a computer could.”

In my opinion, currently, there are noscientific answers to those questions, and whatever you may think aboutit, is more a belief or conviction than a commonly accepted truth or a scientific result.Maybe we have to wait until 2045, which is when Ray Kurzweil predicts technological singularityto occur: the point when machines become more intelligent than humans.While this point is still far away and many believe it will neverhappen, it is a very intriguing theme evidenced by movies such as 2001: ASpace Odyssey, A.I. (Spielberg), Ex Machina and Her, among others.

Leave a Comment on Can machines think? Or are humans machines?

Where are people from Madrid going during the upcoming December holidays?

AI of Things    19 December, 2016

During the early December bank holiday many of us take the opportunity to relax, discover new places or return to our countries of origin. This time, as a further addition to our previous articles about mobility (commuting and contamination), we give you a short insight into our holiday customs during the December break. We have again focused on Madrid as it is a source of mobility which has repercussions all over Spain, which is why many of us will see ourselves portrayed. Just to mix it up a bit this time we are also going to discover some interesting aspects about Toledo.

Where are people from Madrid going during the upcoming December holidays?  

We have went back to using data by SmartSteps focusing on the dwell concept instead of the home and work points of interest that we have previously highlighted in articles. To keep reading with an understanding of the concept let´s break it down; SmartSteps extracts information through two different actions carried out on the mobile network, active events (calls and texts) and passive events (those that simply occur whilst being actively on your mobile). If you are interested in finding out more about SmartSteps we have linked you to this article which explains various concepts in a concise and clear way. We can also take these two types of data and look at where the user has stayed for a significant time and differentiate this with where they have just passed through. 

Before we continue, we must insist in the aggregation and anonymization that govern Smart Steps activities and use of data. In other words, we observe and analyze data of homogeneous groups of people, never of individuals. We have explained this formally in previous posts, and we now summarize it in a simple way: if when reading this article and seeing the graphics you feel pointed at, do not be alarmed, there are many of us doing something similar, and that is why we appear as significant.   Top destinations for people from Madrid this December holiday

The first step we have taken is similar to that of the post about commuting: the heat map in Figure 2 represents the distribution of the chosen destinations of people who normally reside in Madrid.

 
Distribución de los destinos
Figure 2: The distribution of chosen destinations by people who reside in Madrid during the December break.
 
 
The break is usually quite long and most people don´t even spend the entire break in once place, for this reason we have selected the locations in which people have spent the most time during the holidays (longer dwells). Various destination types include:
 
  • Most notable destinations: Barcelona, Toledo.
  • Notable destinations: Valencia, Alicante, Sevilla, Málaga, Cádiz, Guadalajara.
  • The rest of the map see´s various destinations surrounding Madrid and other costal destinations around Spain.
 
This first approach which seems simple has let us raise some initial questions which we want to continue to elaborate with a deeper data analysis. As we unfortunately don´t have enough time to investigate all areas we have decided to take a further look at Toledo. If you live in Madrid it goes without saying you will know someone with family from there, but in the map Toledo is quite highlighted. In principle we could also say that Guadalajara could have had a similar trend as it has akin population to Toledo. Madrid and Toledo are actually quite linked. Is this through family, tourism or gastronomy?
 

Toledo, a simple coincidence?

To further continue our investigation, we want to discover whether this was a temporal occurrence or something that happens on a regular basis. For this reason we have aggregated the data from the December break whilst also combining it with 9 other weekends throughout the year. We can reflect on the results in Figure 3.
 
Diagrama sunburst

Figure 3: This diagram includes 100 provinces that could be selected by the “madrid-toledo” intersection during the given time frame of the 9 analysed weekends.

For this visual representation we have reused one of the examples from the D3 library and represented this information focusing on the “Madrid-Toledo” group. We are talking about a Javascript library that is a big help when it comes to the visual representation of data. As well as being able to use it directly for websites, it can also be used according to your needs, meaning that it can be used in collaboration with the majority of visualisation tools for data.

To explain figure 3, we have taken the top 100 most frequent destination combinations throughout the 9 different weekends to give the data the best sense of scope. Using this base we can see those who went to Toledo for their break, the percentage of people who usually stay solely in Madrid, those who always go to Toledo, Madrid-Toledo-Alicante, Madrid-Toledo-Alicante-Valencia.

  We can sum the data up by creating the following groups:  

  • People who are originally from Toledo:
    1. Approx. 1 in 3 return to Toledo every weekend from the study which allows us to deduct that these passengers have permanent connections based in Toledo.
    2. Approx. 1 in 5 spend their breaks between Madrid and Toledo. For this reason we can say that they have permanent connections based in Toledo, but they don’t visit them as often.
  • People who are originally from Madrid:
    1. Aprrox. 1 in 5 stayed in Madrid during all 9 of the weekends making it clear that they went to Toledo for a random excursion.
    2. Tourists from Madrid and Tourists from Toledo: There’s a group of tourists who almost always stay in Madrid but sometimes visit the province of Valencia. Another smaller group who almost always go to Toledo but also visit the province of Valencia.
  • Within the group who normally vary between Madrid and Toledo there is a third option of people who head towards the province of Valencia. Although if we look a little closer we can see that more diverse destinations start to appear.

We can clearly see the success of the province of Valencia, with the most successful city from the region being Alicante. The left hand graph from Figure 4 shows the overall percentage (considering all destination combinations and not only the first 100) and can also confirm the previously cited example of groups from Toledo. The right hand graph backs up the success of the province of Valencia in terms of the occassional visit from people from Madrid.  

Porcentaje de los madrileños por destino

  Figure 4: Left showing the percentage of people based in Madrid in relation to their destination. Right showing the percentage of people from Madrid who also went to the province of Valencia.

Ultimately this analysis has started to explain the travel habits of the Spanish in terms of the frequency of the different types of weekend breaks they choose and the number of different destinations in terms of these trips.   The further we delve into analysis the more we want to know about the various outcomes of our research but, due to time constraints we will have to continue this with a future blogpost. The LUCA team hope that you have enjoyed this new journey around Spain and left you wanting to know more. For any blogpost suggestion, doubt that needs to be cleared or proposal you can always contact us here.

ElevenPaths discovers the Popcorn ransomware passwords: no need to infect other people to decrypt for free

Florence Broderick    15 December, 2016
MalwareHunterTeam has discovered a new variant of ransomware that is quite curious. At ElevenPaths we have been able to download and analyze the new improved versions that make several interesting mistakes, for example one that reveals your decryption password. This sample draws attention because, in theory, it offers two formulas to decrypt the files: either by paying, or if the infected succeeds in infecting two or more people who pay the ransom.

The “easy” way and… the “nasty” way

Apart from what has already been commented on this new version, we focus on the most interesting aspects of the evolution that we, at ElevenPaths, have analyzed. The basic functionality is as usual: a lot of files are encrypted depending on their extension, and a ransom of 1 bitcoin is requested (above the average that is usually demanded). What this ransomware does for the first time is to offer two ways to decrypt the content: the “normal” way, in which a ransom is paid, and the “nasty” way (so they call it), in which if a link to an executable is sent to two people and they get infected and pay, you will be given a “free” code to decrypt your content. A diffusion “Refer-a-friend plan” in which the attacker “ensures” two infections for the price of one, and a more effective dissemination method, since the victims chosen by the infected user will always be more predisposed to execute the link from an acquaintance. Another option is to pay (alleged condition for the “discount”). It is also important to note that the ransomware appeals to the sensitivity of the victim, stating that the money will go to a good cause: alleviate the effects of the Syrian war. It is called “popcorn” because the first version used the popcorn-time-free.net domain, although the latest versions do not.

Appealing to the sensitivity of the victim.
They also lie when they say that there is nothing to do and that only they can decrypt the data.

Technical aspects

How does this ransomware work at a technical level? It has been developed by an independent group without following the guidelines of the “known” families, and therefore, is not very developed yet. Apart from the versions analyzed by MalwareHunterTeam, at ElevenPaths we have had access to the new samples. These are some interesting aspects that we have noticed.

The program is written in C# and needs .NET4 to run. The executable is created “on the fly” for each infected user, with a unique ID code inserted for each victim. Interestingly enough, all variables are “embedded” in the code, and it is created on the server side. In addition, it does not follow the usual pattern of professional ransomware in which each file is encrypted with a different symmetric key and then this key is encrypted with asymmetric cryptography. On the contrary, all files are encrypted with the same symmetric key. From here, knowing the password is a matter of analyzing the code of the executable. 

The password

If we disassemble the code with, for example, ILSpy we can see the line containing the password in base64. A quick decode will allow us to get the password and the data back. We have not created a specific tool to do this, as it is more than likely that the attacker quickly changes the strategy and also, for now, this malware does not seem to be very advanced or widespread (if someone is infected, please contact us). In fact, the day before the password of its first versions was always “123456”.

As mentioned, the password is supposed to be (along with all other variables) embedded by the server at the time the executable is created. After the analysis we have conducted, it turns out it is an MD5 hash of which we still do not know what it responds to. The MD5 hash is triply encoded with base64 in the code.

Partof the code where the password appears and how to decode it in base64. Click to enlarge

The result of the decoding is the password that can be entered in the corresponding dialog to decrypt the data without having to pay at all.

The rest of the code is sometimes messy, although it seems they are working day by day to improve it. For example, the salt in the cryptographic function is not random. This, which in any other circumstance would allow a precomputed dictionary attack, really does not have much effect here (the password is not in a dictionary, it is a hash), but it gives us an idea of the little cryptographic value that this ransomware has.

A not very useful salt (12345678), although it is not very important here.

HTML code

The HTML code that is displayed to the victim forms a very important part of this malware. It is also embedded encoded in base64 in the code. In it we can see that a verification is conducted using the APIs of the Blockchain.info (misused, it encloses the wallet in quotation marks) in order to know if the payment has been made and if it is validated in the blockchain. It uses Satoshis, which are a fraction of a bitcoin.

They misuse the API of Blockchain.info, although later they correct it

If so, they display some URLs hidden in JavaScript that are supposed to give access to the decryption code, and hosted in the Tor network. This protection (using a “hide” class) is ridiculous. When we access the URLs, the truth is we cannot see any decryption code (we guess that because they are still in the trial stage).

They are supposed to provide you with the decryption code when you pay and visit those URLs, but it does not look like it.

Refer-a-friend plan

What stands out the most about this is the “nasty way” to decrypt the files. Allegedly, if you send the executable link to two acquaintances and they pay, you will be given the unlock code. It is a very smart way to get a fast diffusion, but we think it is not true. The code does not contain any instructions to verify that this happens automatically. Unless all intelligence runs from the server side (which we doubt), we cannot guarantee (nor have we technically proven that it happens) that this is so and, therefore, this is more likely to be just a hoax to spread more malware. In fact, the generated executables do not contain information about who has recommended them, only the fact that they have been created under a URL that does indeed contain the ID of the initial victim. But looking at the entire system, its poor programming, unfulfilled promises, threatening countdowns that in the end do not erase a thing and the unstable infrastructure and “craftsmanship” in general, Occam’s razor makes us lean to think that everything is false and that there is no mechanism to control this.

Remember that we have a tool with an approximation of proactive protection against ransomware that you can (soon) download from our laboratory.

Sergio de los Santos

Marathon Commuters: Which nationalities spend most time travelling to and from work?

AI of Things    14 December, 2016
Just 600 cities are projected to create more than 60% of global economic growth by 2025.  Our reluctance to distribute population outside of these urban powerhouses has caused city property prices to rise astronomically and our infrastructure hasn’t always been able to grow fast enough to accommodate the growing number of commuters around the world.

In the UK, the number of people spending more than two hours travelling to and from work every day has increased to 72% over the past decade to more than 3 million people, according to research by TUC.  In fact, British commuters spend more than a tenth of their disposable income on annual rail tickets as the BBC mentioned in this 2016 report.  This expensive and exhausting process has even caused some workers to consider commuting between countries (e.g. Barcelona to London) – a model which is clearly not aligned with the Sustainable Development Goals set by the UN.
However, this culture of “marathon commuting” in the UK is not a consistent problem across the whole of Europe. Although the UK has the highest percentage of journey times over 2 hours (30%), countries like Madrid, Paris and Berlin are much lower at just 15% – suggesting that either their public transport infrastructure is better or people live closer to where they work, among other reasons.

Average commutes
Figure 2: Average commute times in metropolitan areas with over 1 million residents.
This is something that we decided to analyze, using our mobile data product, Smart Steps.  Although comparably Barcelona doesn’t have the worst commuting challenge (as you can see above), we worked alongside Barcelona City Council and Bestiario, looking at anonymized and aggregated Big Data to map commuting patterns in the city. By identifying home and work locations, we were able to understand the flow of workers and students around the 73 districts of Barcelona – providing insights on how long people spend commuting, their demographic profile and how far they live from their work. The study is explained in the video below:

Barcelona has become a hub for innovation when it comes to taking a data-driven approach towards urban planning and mobility.  With a population of 4.6 million in the wider urban area and a population density of over 16,000 people per square kilometre, as well as a thriving tourism industry – using cutting-edge Big Data and Internet of Things technology has become fundamental in optimizing the city to make it greener.
A great example of this approach is the Barcelona Ciutat Digital plan, which prioritizes Smart City and Open Data projects to improve the quality of life for citizens. This innovation and transparency is crucial in ensuring that Barcelona continues to to drive an even more sustainable model when it comes to commuting, mobility and traffic.

Here at LUCA, we are aware of the great challenges facing cities when it comes to sustainability. We also understand that the actions policy makers need to take go much further than monitoring and measurement. However, we strongly believe that becoming data-driven is the best place for the public sector to start. To find out more, visit our website or contact us here.

How “intelligent” can Artificial Intelligence get?

Richard Benjamins    13 December, 2016

This post is the second in a series of three posts, each of which discuss the fundamental concepts of Artificial Intelligence. In our first post we discussed AI definitions, helping our readers to understand the basic concepts behind AI, giving them the tools required to sift through the many AI articles out there and form their own opinion. In this second post , we will discuss several notions which are important in understanding the limits of AI.

Strong and weak AI

When we speak about how far AI can go, thereare two “philosophies”: strong AI and weak AI. The most commonlyfollowed philosophy is that of weak AI, which means that machines canmanifest certain intelligent behavior to solve specific (hard) tasks,but that they will never equal the human mind. However, strong AI believes thatit is indeed possible. The difference hinges on thedistinction between simulating a mind and actually having amind. In the words of John Searle, “according to Strong AI, the correctsimulation really is a mind. According to Weak AI, the correctsimulation is a model of the mind.”

The Turing Test

Turing test
Figure 2. The set up of the original Turing Test.

The Turing Test was developed by Alan Turing in the 1950s and was designed to evaluatethe intelligence of a computer holding a conversation with a human. Thehuman cannot see the computer and interacts with it through aninterface (at that time by typing on a keyboard with a screen). In thetest, there is a person who asks questions and either another person or acomputer program responds. There are no limitations as to what theconversation can be about. The computer passes the test if the personcannot distinguish whether the answers or the conversation comes fromthe computer or the person.
ELIZA was the first program that challenged the Turing Test, even though it unquestionably failed. A modern version of the Turing Test was recently features in the 2015 movie Ex Machina, which you can see in the video below. So far, no computer or machine has passed the test.

The Chinese Room Argument

A very interesting thought experiment in the context of the Turing Test is the so-called “Chinese Room Experiment” which was invented by John Searle in 1980.This experiment argues that a program can never give a computer theability to really “understand”, regardless of how human-like orintelligent itsbehavior is. It goes as follows: Imagine you are inside a closed room with door. Outside the room there is a Chinese person that slips a note with Chinese characters under the door. You pick up the note and followthe instructions in a large book that tells you exactly, for the symbolson the note, what symbols to write down on a blank piece of paper. You follow the instructions in the book processing each symbol from thenote and you produce a new note, which you slip under the door.  The note ispicked up by the Chinese person who perfectly understands what iswritten, writes back and the whole process starts again, meaning that a realconversation is taking place.
Chinese Room menta experiments
Figure 3. The Chinese Room mental experiment. Does the person in the room understand Chinese?

The key question here is whether you understand the Chinese language. Whatyou have done is received an input note and followedinstructions to produce the output, without understanding anything aboutChinese. The argument is that a computer can never understand what itdoes, because – like you – it just executes the instructions of asoftware program. The point Searle wanted to make is that even if thebehavior of a machine seems intelligent, it will never be really intelligent.And as such, Searle claimed that the Turing Test was invalid.

The Intentional Stance

Related to the Turing test and the Chinese Room argument, the Intentional Stance,coined by philosopher Daniel Dennett in the seventies, is also of relevance for this discussion. The Intentional Stancemeans that “intelligent behavior” of machines is not a consequence of howmachines come to manifest that behavior (whether it is you followinginstructions in the Chinese Room or a computer following programinstructions). Rather it is an effect of people attributing intelligenceto a machine because the behavior they observe requires intelligence ifpeople would do it. A very simple example is that we say that ourpersonal computer is thinking when it takes more time than weexpect to perform an action. The fact that ELIZA was able to fool somepeople refers to the same phenomenon: due to the reasonable answers thatELIZA sometimes gives, people assume it must have some intelligence.But we know that ELIZA is a simple pattern matching rule-based algorithmwith no understanding whatsoever of the conversation it is engaging in.The more sophisticated software becomes, the more we are likely toattribute intelligence to that software. From the Intentional Stanceperspective, people attribute intelligence to machines when theyrecognize intelligent behavior in them.

To what extend can machines have “general intelligence”?

One of the main aspects of human intelligence, is that we have a generalintelligence which always works to some extent. Even if we don’t havemuch knowledge about a specific domain, we are still able to make senseout of situations and communicate about them. Computers are usually programmedfor specific tasks, such as planning a space trip or diagnosing aspecific type of cancer. Within the scope of the subject, computerscan exhibit a high degree of knowledge and intelligence, butperformance degrades rapidly outside that specific scope.
In AI, this phenomenonis called brittleness (as opposed to graceful degradation, which is how humans perform). Computer programs perform very well in theareas they are designed for, outperforming humans, but don’t performwell outside of that specific domain. This is one of the main reasons whyit is so difficult to pass the Turing Test, as this would require the computer to be able to “fool” the human tester in any conversation,regardless of the subject area.In the history of AI, several attempts have been made to solve the brittleness problem. The first expert systems were based on the rule-based paradigm representing associations of the type if X and Y then Z; if Z then A and B,etc.  For example, in the area of car diagnostics, if the car doesn’t start, then the battery may be flat orthe starter motor may be broken. In this case, the expert system wouldask the user (who has the problem) to check the battery or the check thestarter motor.
The computer drives the conversation with the user toconfirm observations, and based on the answers, the rule engine leads tothe solution of the problem. This type of reasoning was called heuristicor shallow reasoning.However, the program doesn’t have any deeper understanding of how a carworks; it knows the knowledge that is embedded in the rules, but cannotreflect on this knowledge. Based on the experience of thoselimitations, researchers started thinking about ways to equip a computerwith more profound knowledge so that it could still perform (to someextent) even if the specific knowledge was not fully coded. Thiscapability was coined “deep reasoning” or “model-based reasoning”,and a new generation of AI systems emerged, called “Knowledge-BasedSystems”.
In addition to specific association rules about the domain,such systems have an explicit model about the subject domain. If thedomain is a car, then the model would represent a structural model ofthe parts of a car and their connections, and a functional model of howthe different parts work together to represent the behavior of the car. Inthe case of the medical domain, the model would represent the structureof the part of the body involved and a functional model of how it works.With such models the computer can reason about the domain and come tospecific conclusions, or can conclude that it doesn’t know the answer.
The more profound the model is a computer can reason about, the lesssuperficial it becomes and the more it approaches the notion of general intelligence.Thereare two additional important aspects of general intelligence wherehumans excel compared to computers: qualitative reasoning and reflectivereasoning.
Figure 4: Both qualitative reasoning and reflective reasoning differenciate us from computers.

Qualitative reasoning

Qualitative reasoningrefers to the ability to reason about continuous aspects of thephysical world, such as space, time, and quantity, for the purpose ofproblem solving and planning. Computers usually calculate things in aquantitative manner, while humans often use a more qualitative way ofreasoning (if X increases, then Y also increases, thus …). The qualitative reasoning area of AI is related to formalism and the process to enable a computer to perform qualitativereasoning steps.

Reflective reasoning

Another important aspect ofgeneral intelligence is reflective reasoning. During problem-solvingpeople are able to take a step back and reflect on their ownproblem-solving process, for instance, if they find a dead-end andneed to backtrack to try another approach. Computers usually justexecute a fixed sequence of steps which the programmer has coded, withno ability to reflect on the steps they make.  To enable computers toreflect on their own reasoning process, it needs to have knowledge aboutitself; some kind of meta knowledge. For my PhD research, I built an AI program for diagnostic reasoning that was able to reflecton its own reasoning process and select the optimal method depending onthe context of the situation.

Conclusion

Having explained the above concepts, it should be somewhat clearer that there is no concrete answer to the question posed in the title of the post, it depends on what one wants to believe and accept. By reading this series, you will have learned some basic concepts which will enable you to feel more comfortable talking about the rapidly growing world of AI. The third and last post will discuss the question whether machines can think, or whether humans are indeed machines. Stay tuned and visit our blog soon to find out.
Leave a Comment on How “intelligent” can Artificial Intelligence get?

Air Quality: How can Open Data and Mobile Data provide actionable insights?

AI of Things    12 December, 2016
 

Today on our blog we’ve decided to take the mobility and traffic Big Data  analysis we started here a little bit further, looking at the relationship between commuting and air pollution. Air quality is clearly a major challenge for large urban areas and according to the WHS, it is also a serious health risk, which is concerning given that in 92% of the world population in 2014 was living in places where the WHO air quality guidelines levels were not met


Reducing road traffic to improve air quality is proving a struggle for local governments, and to address this issue, they are monitoring a range of harmful gases on a day to day basis. One of these is Nitrogen Dioxide (NO2), and its production correlates directly to the density of motorised vehicle traffic as well as atmospheric conditions.
To investigate this, we decided to visualize our Smart Steps data on mobility in Madrid alongside Open Data about NO2 measurements from the Madrid “Datos Abiertos” website. Here, we could find pollution measurement data from a range of air pollution sensors throughout the city, including the locations and the types of stations. You can also find local government policies on pollution protocol when NO2 levels are too high, citizen advice relating to air quality and information on their mobile application here.
In our study, we focused on hourly NO2 readings registered in the 24 available stations from January to September 2016. To get the whole picture, it was important for us to find out (1) how often the stations exceeded alarm levels (200 micgr./m3), (2) the average levels (<40 micgr./m3 as normal average) and (3) the type of the stations (close to roads, residential areas, underground stations).
Once the data was processed, it was relatively straightforward to build a dashboard to analyze the behaviour of each of the stations across the period as you can see below:
Dashboard
Figure 2: Dashboard (TIBCO Spotfire) with the KPIs about the NO2 measurements in Madrid.
The dashboard in figure 2 reveals some clear insights: 

  1. There is a significant increase of NO2 pollution in September, probably due to the lack of rain and wind (top right). 
  2. Unsurprisingly, there are clear increases during rush hours (from 7:00 to 9:00 in the morning and 20:00 to 22:00 in the evening), although interestingly during the evening rush hour NO2 pollution levels are very similar regardless of whether it is a week day or the weekend (figure 3).
Hourly average
Figure 3: Hourly average NO2 levels per day of the week.
As a next step, we overlaid average NO2 levels on top of the density of workers in each postcode. As you can see in figure 3, there is a clear correlation between NO2 levels, the type of station and the density of traffic and both variables. Furthermore, there is a “green dot” in the middle of Madrid which represents the 350 acre Retiro Park. According to the data, this is unsuprisingly the best place to go you want some fresh city air, any time or any day of the week.
Postcodes in central Madrid
Figure 4: Postcodes in central Madrid represented as coloured polygons according to the density of workers (red denoting a greater density).  The markers represent air pollution sensors across the ctiy. 
In the above image, the markers denote air pollution monitoring stations. The red marker color shows that the station exceeded the average city pollution level for most of the months in the data-set. One should consider that 3 out of these 4 stations are close to a main street or motorway which results in higher measurements. When comparing against other cities around the world, the air quality in Madrid isn’t actually that bad, as only 4 out of 24 stations exceeded the recommended threshold of 40 micgr./m3 (on average). ,

One should also highlight that there is one station in Madrid’s city centre (in the Plaza del Carmen) which registers high NO2 levels even though it is located close to a pedestrianized zone. However, when we take a closer look at Google Maps, we can see it is located between two car parks, which explains the above-average NO2 readings.

The video we have prepared below shows how the usual home-work-home routes are closely related to pollution patterns. You will also see how areas with higher worker density have higher pollution levels, even though not all highly polluted areas have high worker density.


As we only analyzed pollution data for the centre of Madrid, we were curious to look at the rest of the Madrid region. We found a 2013 official report with a heat map of areas surpassing the maximum 200 mic./m3 threshold, then we made a visual comparison with the density map generated from Smart Steps mobility patterns (figure 5 and figure 6), showing considerable similarities as you can see below.
Air quality in Madrid Region
Figure 5: Air quality (NO2) in Madrid Region.
Geographic distribution of the number of hours with values greater than 200
micrograms/m3.
Heat map
Figure 6: Heat map generated from density of workers in the region of Madrid.
Overall, it is important to mention one limitation when assessing the statistical significance of such “visual” correlation: the low number of available stations. Although a data-driven approach to pollution is extremely important for society, it also isn’t affordable to place dozens of stations across the city to measure harmful gases such as NO2. One cheaper alternative would be to place mobile stations to monitor NO2 levels, which is one of the main objectives of the EU Japan collaboration project. The local government of Madrid is currently starting to deploy this mobile solution across the city’s bus network as you can see in this article.

We would love to play with the data collected from those mobile sensors in order to create a correlation model of traffic and pollution.  However, in the mean time, we have Smart Steps data as a powerful complementary source to find out which areas of the city are affected by NO2 more importantly, making short term forecasts for policy makers to act accordingly.

Needless to say, we would encourage all of our Madrid-based readers to use public transport, car sharing services and cleaner vehicles to ensure we start to reduce traffic and create a healthier city for the future, in line with the UN Sustainable Development Goals.
By Javier Carro and Pedro de Alarcón, PhD. Data Scientists at LUCA.

Latch Plugins Contest 2016 is over

Florence Broderick    12 December, 2016
Today, Monday, December 12 at 1 pm (CET), was the deadline for the submission of plugin applications to the Latch Plugins Contest, the Latch contest that looks for innovative and handy plugins for the Latch service. Any project submitted after this deadline will be invalid and will not enter the contest.

Now it is the turn of our jury, a top-level jury, composed of Chema Alonso, CEO CDO; José Palazón, CTO CDO; Pedro Pablo Pérez, VP Global Security; Alberto Sempere, Security Global Product Director, and Olvido Nicolás, CMO Global Security.

As you know, the jury of ElevenPaths will acknowledge:

  • Creativity, we are sure that you are inventive! 
  • Utility of the solution, simplicity and usability are very important. 
  • Effort, which is always rewarded. 
  • Thoroughness of the solution, the more complete the better. 
  • Clarity of documentation. 
  • Compliance with the submission date of the candidature.

After the deliberation phase, you will know if you have won one of our juicy prizes: up to $5,000 (in bitcoins).

Stay tuned! Winners will be notified by email during the 14 days following the closing date of the contest. You will then have 10 days to accept the prize.

Follow all the details in our blog and in the #LatchPluginsContest hashtag.

#LanzamosLUCA: Dave Sweeney on using Mobile Data to disrupt Transport and Tourism

Ana Zamora    9 December, 2016

This week we share the launch presentation of Dave Sweeney, our Commercial Lead for Public and Transport sectors in the UK.  Dave told us all about about how mobile data insights are bringing new value to decision-makers who are looking to innovate with their data collection strategies, optimizing their businesses and reducing ineffiencies in both transport and tourism.

Dave explained several case studies from both sectors, bringing an overview of how data is already being used to improve the services and products of different public bodies. According to Dave, “Big Data is moving from a buzzword, to something bigger that can influence our cities and have a really positive effect in society“.

Dave Sweneey
Figure 1: Dave Sweneey discusses the importance of Big Data for society.
Starting with the transport sector, Dave used London as an example, where over 2 million people move around the city every day. To provide insights on traffic, they need an agile and accurate dataset. After processing all of our mobile data using our Smart Steps technology, we can give a really good view of how people flow around the country. We are also able to understand which mode of transport people are using, and which are the most common routes (by identifying points of interest such as work and home).
Dave went on to explain our success in transport, sharing that we have now carried out more than 300 projects in over 10 different countries. He explained how we have engaged directly with the public sector, private companies and specialist transport consultancies, who have all benefited from our data. His first example of this was Highways England, one of our most important customers in the UK, as well as Transport for London.
Dave then moved on to discuss some case studies from Spain and Latin America where we have been engaging with the tourism sector. He discussed how important data is to decision-makers in this sector in order to understand who is visiting their cities, where they come from and how often they visit.

At LUCA we are able to provide an accurate analysis of tourist behaviour, giving insights on their catchment and their profile (e.g. country of origin, gender and age).  This allows both public and private sector organizations to tailor their products and services better for tourists – providing an even better experience for the increasingly demanding tourist of today.

An example of this is our recurring work with the local government in Girona on “Temps the Flors”, a festival which takes place every year which we discussed on our blog last week. Dave also mentioned our “Las Fallas” project, which provides an analysis of tourist behaviour at this popular Valencian festival.  In this project, we enabled the local government in Valencia to optimize their marketing campaigns using data.  For example, by promoting an Amsterdam-Valencia flight route in reaction to the insight about the popularity of the festival amongst Dutch tourists.


To find out more about our innnovative tourism and transport products, see Dave’s full presentation below:

Video 1: Dave Sweneey discusses the Big Data disruption in Transport and Tourism