A formula for Victory: Big Data in Formula 1

AI of Things    14 May, 2018
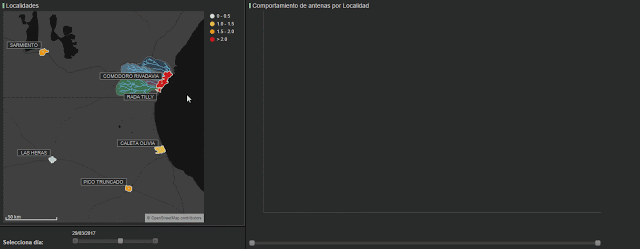
Japan 1990, most die-hard Formula 1 fans remember the eventful race in Suzuka circuit. As was usual during the late 80’s and early 90’s, Ayrton Senna and Alain Prost, two of the fiercest rivals in sports history, were fighting for first place once again. Suddenly, as if it was a deja-vu from the year before, the Ferrari and McClaren collide,and the championship ends. This time though, with Senna becoming World Champion. Spectators all around the world saw both drivers jumping out of their seats, their tempers flaming like wildfire.

This past Sunday at the Barcelona Grand Prix, the race was very different. Not only have circuits become safer, but the ability to use data and algorithms has allowed drivers and their engineering teams to better map out overtakes, to avoid situations like the crash mentioned above. 

In Barcelona, Lewis Hamilton and Valteri Bottas took first and second place, after an event fueled start, with a multi car crash caused by Romain Grosjean. Even though no one was seriously injured, the car sent “high impact” alerts and a medical checkup was ordered for Grosjean. Small details that seem routine now, like these, were not available before. 

When victory hangs on just a fraction of a second, data can be the turning point between winning first and second place. It is widely known that many sports are already using Big Data to help performance. Cyclists rely on data collected by LUCA to improve endurance and technique, eSports are also incorporating data use to determine which areas need more focus, but perhaps one of the most interesting sports when it comes to data is Formula 1 (F1).

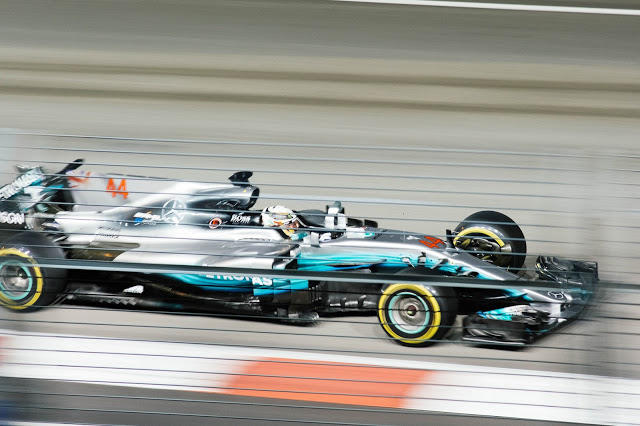
Figure 1: Lewis Hamilton has beat the previous record with 41 wins from pole position
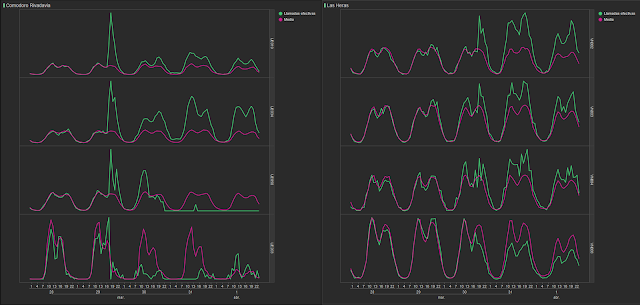
An F1 car can produce over 300GB of data per race weekend, giving the team and the driver endless possibilities to see where things go right or wrong. Matt Harris, Chief of IT at Mercedes-AMG Petronas says “the car is an internet of things” and Mercedes-AMG Petronas equips their cars with about 200 sensors that collect data over the weekend. On race day, sensors are removed since they add on extra weight, so around 80% of data being collected pre-race (Friday and Saturday). For Lewis Hamilton, data is “a new way of life”, leading him to become very data-driven and fact focused. Having won four world championships already, this decision along with his extreme dedication has paid off.
Mercedes-AMG Petronas has been collaborating with different companies in the telecommunications and data fields, and through this, the team has been able to maximize performance and time. While a team of engineers is working at the pits, a second team back at their home base is also analyzing data and drawing insights. Tibco, experts in integration and data analytics software, have worked together with Mercedes-AMG Petronas to create a model that analyzes data and creates different scenarios for overtaking moves. Qualcomm, a company that markets and designs wireless telecommunication products and services is also a partner. Mercedes uses Qualcomm’s Snapdragon processor, which collects data and transmits it to the garage through a fast WiFi connection.
McClaren is another leading team that makes sure that every piece of their cars makes use of the historical data collected, and the results from simulations done beforehand. Geoff McGrath, Chief Innovation Officer at McClaren mentioned to Fortune Magazine how even though all of this data collection is helping the cars and therefore driving experience better, that the driver is the ultimate “sensor” they have, the only one who can feel the racetrack. Data analytics does help performance, as we mentioned before, but also allows the drivers to focus on what they like best, driving.

Speaking about contact with the track, tyres are the only point of contact between the driver and the asphalt, and are crucial when it comes to saving or losing time. Softer tyres provide more grip but need replacing more often, resulting in more pit stops, and harder tyres are more durable but have less grip. Often, drivers need to make split second decisions; do they stick it out and finish more laps with the same pair, or stop and change? One bad choice could cost them valuable time, and in F1, time really is gold.  Doesn’t this make you look forward to the next race already?
It is important to track down how each type fares in each lap and their temperature, to be able to test out and check what is best for each team. Pirelli recently released two new tyre types, Hypersoft (pink) and Superhard (orange). Hypersoft are best for lower speed in tracks, with less abrasive asphalt such as Monaco or Canada, and have received rave reviews from Champions like Lewis Hamilton. Without properly tracking the performance of each tyre, and on each track, it would be impossible to calculate how many pit stops a driver needs to make, what type of tyres to start the race with and if combining different types will be beneficial as well. In Barcelona, many teams mentioned tyre challenges, so they continue to be an element of surprise race to race.
Figure 2: Technology and processes used in F1 can be applied to smart cities and medical care
Now, car performance is second to the health of the driver, and for this, special biometric gloves have been created that will measure heart rate and oxygen levels to monitor their vitals during the race, and during and after a collision. This is important as by tracking vitals remotely, medical staff is aware how the driver is doing before they reach the scene.  The same goes for tracking the vitals of the pit crew, which Williams did a couple of seasons ago, to determine the stress levels and where each member of the crew would need more training in. F1 has even inspired medical staff from the University Hospital of Wales (UHW) to visit the Williams factory to observe the team’s pit stop practice, to be able to apply their detailed coordination and attention to detail, to patient care and resuscitation processes. “We are increasingly finding that Formula 1 know-how and technology can have benefit to other industries and this is a great example,” Mentioned Claire Williams, deputy principal for the team, showing how any best practices are meant to be shared with other industries.
While many will argue that technology has beat intuition, the reality is that this has given drivers a lot more room to excel without worrying about why certain things happen and why, and has opened the floodgates of the information they can get their hands on. In the end, the driver decides what to do, when to top and when to overtake. The difference with data is that their intuition is supported with facts and allows for planning.
Long gone are the days when Niki Lauda, Ayrton Senna and Nigel Mansell ruled the circuits. The sport has had an interesting evolution especially with the introduction of technology and putting data first. As we focus on the future of the sport, it’s chilling to think of what will come next season and who will reign the podium. For now, let’s see what Monaco brings next! Do you have your predictions about the winners already? 

Don’t forget you can follow us on TwitterLinkedIn and YouTube to keep up to date with all things LUCA.

New report: Malware attacks Chilean banks and bypasses SmartScreen, by exploiting DLL Hijacking within popular software

ElevenPaths    11 May, 2018
ElevenPaths has spotted an enhanced and evolving Brazilian banking trojan (probably coming from KL Kit,) through using a new technique to bypass the SmartScreen reputation system and avoid detection in Windows. It targets mainly Chilean banks, and this Trojan downloads legitimate programs and uses them as a “malware launcher” injecting itself inside, in order to take advantage of “dll hijacking” problems in the software. In this way, the malware can be launched “indirectly”, and bypass the SmartScreen reputation system and even some antiviruses.


Amongst the ransomware plague, Banking Trojans are still alive. ElevenPaths has analyzed N40, which is an evolving malware that is quite interesting, in relation to the way it tries to bypass detection systems. The trojan is, in some ways, a classical Brazilian banking malware that steals credentials from several Chilean banks, but what makes it even more interesting are some of the features it includes, which are not that common in this kind of malware.

DLL Hijacking
DLL hijacking has been known for years now. Basically it consists of a program which does not check the path properly of where the DLLs is loaded from. This would allow an attacker which has the ability to replace or plant a new DLL in some of these paths, to then execute arbitrary code when the legitimate program is launched. This is a known problem and used technique, yet we are aware that not all of the DLL hijacking problems are equally as serious as each other. Some problems are mitigated by the different ways and search order in which DLLs are loaded, the way in which the permissions are set where the executable file lies, etc. This malware is aware of this, and it has turned “less serious DLL hijacking problems” into an advantage for the attackers to avoid detection systems and, in turn, a powerful tool for malware developers. This will probably force a lot of developers to check again the way in which they load DLL from the system, if they do not want to be used as a “malware launcher”.

Some of the DLL that may be used for DLL hijacking

What makes this malware really remarkable, is that it consists of two different stages.

  • The downloader (first stage) downloads a copy of a legitimate program with a DLL Hijacking problem from a server. It is the original, signed, legitimate executable file, so it will not raise any alerts. 
  • Then it downloads the malware (second stage) in the same directory; this is a DLL which is signed with certificates sold in the black market. These certificates contain the name of “young” real British companies, but most likely these certificates are not stolen, just created “borrowing” real names from public sources from companies’ info.

In this case, the malware abuses a DLL hijacking problem in VMnat.exe, which is an independent program that comes with several VMware software packages. VMnat.exe (like many other programs) tries to load a system DLL called shfolder.dll (it specifically needs the SHGetFolderPathw function from it). It firstly tries to load it from the same path in which VMnat.exe is called; if it is not found, it will check in the system folder. What the malware does is it places both, the legitimate VMnat.exe and a malicious file renamed shfolder.dll (which is the malware itself signed with a certificate) in the same folder. VMnat.exe is then launched by the “first stage malware”, which first finds the malicious sfhfolder.dll and then loads it into its memory. The system is now infected, but what SmartScreen perceives is that something has executed a reputable file.

Through this innovative movement the attacker can:

  • Bypass antivirus signatures easily; but they cannot bypass the endpoint security (heuristics, hooking) as much. Launching vmware.exe is indeed less suspicious, and malware gets in by this way, through some kind of “second stage” execution that is less noisy within the system.
  • SmartScreen is based upon reputation, and hard for attackers to bypass. That is why executing a legitimate executable file like VMware.exe and loading a signed DLL (which is malware, in turn) makes it much harder for SmartScreen to detect.

More interesting features
This malware, of course, uses some other interesting (but previously known) techniques. It is strongly prepared to bypass static signatures (at least temporarily) and uses “real time string decoding”. When it is launched, it keeps every single encrypted string in its memory, and only decrypts it when strictly necessary. This allows them to hide even when the raw memory is dumped by an analyst or sandbox.

Clipboard cryptohijacking is an interesting attack vector as well. The malware is continuously checking the victim’s clipboard. If a bitcoin wallet is detected, it quickly replaces it with this wallet 1CMGiEZ7shf179HzXBq5KKWVG3BzKMKQgS. When the victim wants to make a bitcoin transfer, he or she will usually copy and paste the destination address if it is switched “on the fly” by the malware, the attacker expects that the user will unwittingly trust in the clipboard action and confirm the transaction to his own wallet. This is a new bitcoin stealing technique that is starting to become a trend. In this bitcoin address, we have seen 20 bitcoins in the past, some of these funds have been transferred directly to another bitcoin address (supposedly owned by the creators) with 80 bitcoins. This means that the attackers have a lot of resources and success.

Wallet in malware sends the bitcoins to this other wallet, with 80 bitcoins

Conclusions
This malware comes from Brazil, but targets most of popular Chilean banks. It uses previously unknown weaknesses within known software in order to bypass some detection techniques; it is an interesting step forward in the way malware is executed in the victim’s computer. VMware has been alerted about this and has quickly improved its security. Yet, this is not a specific VMware problem, any other reputable program with any DLL hijacking weaknesses, which there are many of, may be used as a “malware launcher”. This gives a lot of space for malware makers to use legitimate and signed malware as a less noisy execution technique..

It uses many other cutting edge techniques such as the clipboard cryptohijacking, communicating with command and control over nonstandard ports which rely on dynamic DNS systems and decrypting memory strings only when it is strictly necessary, etc. All of this makes it a very interesting piece of malware for taking into account how attackers are evolving to avoid detection; even a step ahead of the Russian school who are traditionally more “innovative” within the malware field.

In a nutshell: This is an interesting evolution of Brazilian malware that contains very advanced technique (aside from the usuals not mentioned but which are standard in current malware) against the analysts, antiviruses and effectives against bank entities. Main points are:

  • The ability to keep itself under the radar:
    • Using a previously unknown problem in popular software to be launched.
    • Avoiding being launched if “uncomfortable” software is found in the victim.
    • Analyzing antivirus software in the victim for its own statistics.
    • Ciphering and deciphering strings in memory on the fly.
    • Using not standard communications channels.
    • Signing binaries.
  • The ability to hinder analysis:
    • Packing the software.
    • Complex routines and obfuscated strings.
    • Leaving part of the logic in the server side..
  • Attack vector:
    • Clipboard criptohijacking.
    • “Traditional” banking trojan.
    • “Traditional” RAT.

In the following report you may find more information and IOCs about this threat, with specific IOCs.

Innovación and laboratorio
in Chile and España

Using Data to Manage Emergency Situations

AI of Things    8 May, 2018

Content originally written by Carmen Rodríguez, intern at LUCA, and Javier Carro, Data Scientist within LUCA’s Big Data for Social Good area.

What would you say if we told you that data can help save lives? And if we could use it to help minimize the consequences of a natural disaster?

In LUCA’s Big Data for Social Good area, with have an area of research that focuses on the analysis of data relating to natural disasters (earthquakes, floods etc) with the aim of managing them better. You can watch an example of this work in this post about our collaboration with UNICEF.

The repercussions of such events shows itself in the way we communicate in their aftermath. We call for help from emergency services, we call our friends to see if they are okay, and let our family though that we are safe. These human reactions are reflected in the mobile data from telephone networks and once suitably anonymized and aggregated, can be used to help manage such events.

On this occasion, we have studied the impact of the storm that took place in the Golfo de San Jorge region of Argentina between the 29th March and the 7th April 2017. This event had widespread news coverage for a number of days. Comodoro Rivadavia and Rada Tilly are two regions that are located in the basins of various rivers and their drainage systems. The storm dropped around 232mm on rain on the 29th, in a month where the average rainfall in Comodoro Rivadavia is a mere 20.7mm. This intense rainfall, when combined with the bursting of river banks that flow into the Atlantic Ocean, caused large floods in the city and led to the evacuation of thousands of people.

Figure 1: Meteorological conditions in Comodoro Rivadavia during the dates studied.

What do call records tell us?

In order to carry out analysis, we used hourly call data from different municipalities. Due to the different volumes of calls that were made we were able to group regions as shown in figure 2. In red, we have the highly affected areas (Comodoro Rivadavia and Rada Tilly), yellow shows Caleta Olivia which was moderately affected and blue represents the low impact areas (Camarones, Sarmiento, Las Heras and Pico Truncado).

The following graph shows the number of calls per hour in each of these zones. At first glance, we can already see that for the red lines (ground zero of the catastrophe), there is a sharp peak of calls on the 29th March at 6pm.

Figure 2: The calls analyzed during the study, per hour and for each municipality. The scale is different for each region so that the hourly patterns can be observed more easily.

We can also see an increase in calls in the regions of Sarmiento and Pico Truncado, which shows us that the storms impacted zones that are geographically further away.

In order to dig a little deeper, we calculated the deviation in the number of calls compared to their regular daily and hourly patterns. We normalized this difference and in the following graph each spike shows the large deviations from the traffic we would expect for that time. In this case, we can see that there was a peak in each zone on the 29th.

Figure 3: A graph showing the deviations in the number of calls made compared to their regular hourly and daily behavior. Again, not that different scales have been used in order to facilitate understanding.

In this type of disaster, when there is a flooding due to high rainfall or an earthquake, the reaction is usually immediate. On the 28th, the number of calls was largely in line with the average, and on the 29th there was a large deviation during one specific hour. In the days following, the situation become to return to normal.

In the following map (figure 4), we can see the evolution of the flood. The different colors represent the degree of deviation from the norm. Light green shows the smallest deviations and red represents the largest. We can appreciate the sudden change on the 29th March and how the situation stabilizes afterwards.

Figure 4: The evolution of the storm shown by the deviations in call volumes in each region.

We can again go a bit further with the analysis by analyzing the behavior of each antenna and in this way look at the impacts of the flood in different zones of the same municipality. 

In figure 5, we represent the amount of calls from antennae in various areas, and we can see how some antennae show a larger spike than others. We can also see how some stopped working altogether, probably due to technical faults in the network as a results of the weather conditions.

Figure 5: Call patterns for antennae in different municipalities.

As we can see in figure 6, if we analyze call data (the green line) compared to its normal behavior (the red line) we can also check the differences between the deviations for each municipality’s antennae. Furthermore, we see the different consequences in the affected zones. The graphs to the left represent antenna in Comodoro, showing a large spike at 6pm on the 29th. However, in the graphs on the right (antennae in Las Heras), the impact of the disaster in seen in the days following the event.

Figure 6: A comparison of the call behavior in two areas, showing antennae in Comodoro on the left and Las Heras on the right.

Mobility

Thanks to our mobile network, we can not only see behavior through call traffic, but also mobility behavior by using anonymized and aggregated data. In this way, we can study how people move following a natural disaster.

We have create an “origin and destination matrix” for all the provinces in Argentina and especially the areas that we have been looking at up until now. We have also followed the same method to calculate deviations. In figure 7, you can see how we have applied a filter so that the only visible areas are those that showed large deviations during the period studies. You can see the different mobility profiles across the most affected origin and destination matrices.

We can observe a clear negative deviation in mobility on the 29th March. People move less, are isolated in the disaster zone or don’t travel to and from that area due to the meteorological conditions.

We can also observe a second drop in mobility across all origin-destination combinations. This happened on the 7th April and was caused by a new wave of storms and rainfall in the same areas of Argentina.

Figure 7: Mobility deviations for different origin-destination matrix combinations.

Conclusions

Without doubt, natural disasters greatly affect our behavior and we are left with a trail of data that, once anonymized and aggregated, we can use to respond better to such events.

One possible use case is the creation of alerts for emergency services, that would be able to direct efforts and resources to the most affected areas, or maybe anticipate when the storm’s effects will begin.

Another possibility is to develop an application that would include warnings for the users of the mobile network, which would be capable of alerting them of imminent danger in their area and offer advice regarding precautionary measures.

Clearly, it is important to discern whether the events that we register in this way are natural disasters or if the mobility patters are caused by other events such as concerts. It is possible to do this with the use of other sources and forms of analysis, such as the state of the network itself and Natural Language Processing (NLP) of Twitter activity.

With this analysis, we can continue to test the great potential that data has in such services aimed at social good. We are talking about data that is capable of improving, helping and preventing the possible effects of these catastrophes. For now, don’t forget to follow us on TwitterLinkedIn and YouTube to keep up to date with all things LUCA.

Don’t miss out on a single post. Subscribe to LUCA Data Speaks.

Data to build a better construction sector

AI of Things    7 May, 2018
While many sectors and as a consequence many companies are becoming data driven, some have not yet caught up to this new way of doing business. The construction and building sector, for example, is not an early adopter of new technologies. While there is no exact reason, it is interesting to see how even small changes that involve Machine Learning and Artificial Intelligence could create a ripple effect in how we make things. We have already observed how incorporating anonymized data into transportation with LUCA Transit can help improve flows of people and understand how they move about a city, so how about using data to improve how roads are repaired?

building under construction
Figure 1. Unlike other sectors, construction has not fully embraced AI yet

Volvo for example, widely known for the safety of its vehicles, is leveraging this on their construction equipment. One specific action they are taking is adding “Compact Assist” to their soil and asphalt compactors. Compact Assist is an AI feature that can detect, track and store the temperature, soil density and map of the territory where the vehicle is used. Not only does this allow easy access to past information, but also helps create and keep targets. Imagine a main street needs pavement, and taking an extra two hours to apply it can cause extensive traffic jams. If you commute to work, you already know this is a nightmare, and this is where a technology like this could come in handy. What Compact Direct is able to do is use a “pass mapping” feature to register how many times the compactor has gone over a certain area, and covered the surface completely. No need for wasting extra time or material, only a smooth road ahead.
After overcoming some challenging years due to a financial crisis, construction and building has picked up once again in Spain. According to El Mundo, the construction sector in Spain will show an increase of about 3.5% starting this year, and through 2020, and shows an increase of the same 3.5% for all of Europe.
Architects, interior designers, civil engineers and electricians are only a few of the people involved in making a building come to life. In this data driven age, how can AI and ML help make these processes better?

bulldozer on a construction site
Figure 2. With data, construction sites will become safer and make better use of equipment

When an investment is so large, the last thing the site owner wants is for delays to become costs.  Sticking to deadlines and budgets is an ongoing challenge when taking a project like this to the next level, and this is precisely where utilizing data, especially data collected when it is needed.  One company dedicating themselves to on-site data collection is Doxel, based in Palo Alto, California. Through their self-directed robots and drones, Doxel can give a client the ability to track the progress of a construction site in real-time, give construction workers less margin of error, and the opportunity to fix anything that is moving away from the original building plan. Doxel uses deep learning algorithms to detect inconsistencies. As the CEO of the company Saurabh Ladha mentioned, “You can’t improve what you can’t measure” and by giving data a key role in the process, not only will the cloud have valuable data that all parties involved can use, but provide constant on-site improvements and maximization of resources. A pilot project already proved that Doxel has great potential by finishing 11 percent under the estimated budget.
About 20% of all U.S. injuries and deaths, according to the Occupational Safety and Health Administration (OSHA) happen on constructions sites, and even though this statistic only covers the United States, it gives an idea of the dangers that construction workers face every day around the world. Companies like Triax have taken action and have developed a set of wearables (Spot-r clip, Spot-r Evactag and Spot-r Equiptag) with the aim of creating a connected and safe site. Spot-r by Triax works with IoT technology, to provide data to a dashboard and record how many workers are on-site, worker identification and safety alerts, among many other advantages. Perhaps the most interesting feature is how the wearable can track if someone has been injured (Spot-r clip), and send alerts to aforementioned dashboard, with the location of the person to reduce response time and allow for help to arrive more rapidly. Last but not least, reports can be created to put all the collected data to good use and avoid past mistakes, even if no two projects will be identical.
Considering that one building involves continuous planning, and several people from different fields, anything that could make a process quicker, safer and less costly is always an option to consider. The application of Data has proven once again to be a tool that no matter the sector, when put to good use will make the outcome more precise. This is only the beginning for these technologies to seep into the construction and building sector, and what will come next will in no doubt be bigger and better.

New tool: Neto, our Firefox, Chrome and Opera extensions analysis suite

ElevenPaths    7 May, 2018
In the innovation and laboratory area at ElevenPaths, we have created a new tool which is used to analyze browser extensions. It is a complete suite (also extensible with its own plugins) for the extensions analysis; it is easy to use and provides useful information about extension features of both Firefox and Chrome or Opera.

Neto herramienta imagen


Why should we analyze extensions?
The extensions contain relevant information, such as the version, default language, permissions required for their correct operation or the URL addresses’ structures on which the extension will operate. At the same time, it contains pointers to other archives such as the relevant file path from the HTML file (which will load by clicking on their icon) or JavaScript file references which should run both in the background (background scripts) as with each page that the browser loads (content scripts).

However, the file analysis which make up an extension can also reveal the existence of files which should not be present in production applications. Amongst them, files could appear linked to the management of versions such as GIT or other temporary and backup files.

Of course, there are also extensions which are created as malware, adware, or to spy on the user. There are many and various examples, especially recently in Chrome (where it has already reached a certain level of maturity) and Firefox. Right now it is common for mining code to be hidden within the extensions.

The tool
It is a tool written in Python 3 and distributed as a PIP packet, which facilitates the automatic installation of the dependencies.

$ pip3 install neto

In systems in which they are not provided by the administration privileges, you can install the packet to the current user:

$ pip3 install neto --user

Once installed, it will create for us an entry point in the system, in which we can call the application command lines from any path.

Funcionalidades principales de Neto imagen
The main functionalities of the tool 

There are two functionalities which we have included in this first version:

  • The analyzer itself (extensible through the plugins in order to widen their potential)
  • A daemon with a JSON RPC interface which will allow us to interact with the analyzer from other programming languages.

The different analyzer options can be explored with neto analyser --help. In any case, Neto will allow us to process extension in three different ways:

  • Indicating the local extension path which we have downloaded (with the option -e), 
  • Indicating the system directory in which we have various extensions (with the option -d)
  • Downloading it directly from a URI online (with the option -u). 

In all of these cases, the analyzer will store the result as a JSON in a new file called ‘output’, although this path is also configurable with the command -o.

In order to interact with each other in different programming languages, we have created a daemon which runs a JSON-RPC interface. In this way, if we start it with neto daemon we can get the Python analyzer to perform certain tasks, such as the analysis of extensions stored locally (indicating the “local” method;) or which are available online at (indicating the “remote” method). In both cases, the parameters expected by the daemon correspond to the local or remote extension paths to be scanned. The available calls can be consulted with the “commands” method and can be carried out directly with curl as follows.

$ curl --data-binary '{"id":0, "method":"commands", "params":[], "jsonrpc": "2.0"}'  -H 
'content-type:text/json;' http://localhost:14041

Instead, if we are programming in Python, Neto has also been designed to function as a library. 

$ Python 3.6.5 (v3.6.5:f59c0932b4, Mar 28 2018, 16:07:46) [MSC v.1900 32 bit (Intel)] on win32
Type "help", "copyright", "credits" or "license" for more information.
>>> from neto.lib.extensions import Extension
>>> my_extension = Extension ("./sample.xpi")

In this way, we can Access the different analysis characteristics carried out against the extension, or by accessing the properties directly.…

$ >>> my_extension.filename
'adblock_for_firefox-3.8.0-an+fx.xpi'
>>> my_extension.digest
'849ec142a8203da194a73e773bda287fe0e830e4ea59b501002ee05121b85a2b'
>>> import json
>>> print(json.dumps(my_extension.manifest, indent=2))
{
  "name": "AdBlock",
  "author": "BetaFish",
  "version": "3.8.0",
  "manifest_version": 2,
  "permissions": [
 "http://*/*",
 "https://*/*",
 "contextMenus",
 "tabs",
 "idle",
…

Here is a short clip which shows its basic use.

Plugins and how you can contribute
As it is free software there is the possibility for those who want to contribute something to it through the Github repository. The plugin structure which we can find in the neto.lib.plugins allows for the addition of new static analysis criteria whilst taking into account the analyst’s needs. This becomes a Neto in an analysis suite which we expect to be powerful. Furthermore, the advantage of being distributed through PyPI as a packet is that whenever a new functionality is added, it can be installed with pip by indicating the 'upgrade' option.

$ pip install neto --upgrade
 

Soon we will have more ways to distribute it and information.


Innovation and laboratory

You’ve got mail? You’ve got malware

ElevenPaths    2 May, 2018
A few weeks ago I was ‘compromised’. A well-known vulnerability was exploited and I was left financially exposed, with my reputation potentially at risk. “What happened?” I hear you cry? Well, my debit card was cloned. Not necessarily the end of the world, but a big inconvenience.
Rogue transactions were credited back into my account, a new card issued and no real harm was done. But then the ‘payment declined’ messages started to occur. Certain services I use keep my card details on record for repeat use – my Amazon account, a razor blade subscription, eBay, etc. Basically anything that isn’t a Direct Debit or Standing Order. So it was whilst in this frame of mind – willingly adding new card details to various provider websites – that I was nearly caught out by something which could have been far more damaging.

The great thing about mobility is its ease of use and familiarity – after all my smartphone never leaves my side. Like most of us today it’s helped me become an adept multi-tasker, happily watching TV whilst flicking through Strava, Facebook, email and 101 other apps. But as I watched, another payment declined email came through, this time from Netflix. I clicked on the link to add my new card details but something didn’t look quite right. I noticed that they asked for data not relevant in the UK and it appeared to have a look and feel that wasn’t the normal, professional Netflix site I’m familiar with. Given a little less concentration, I could have easily tapped in my card details and be back to square one; inputting details into a fake site only to be compromised again.
But that’s not all. Debit card fraud can be quickly spotted given its scale and impact, and the remedial measures can be relatively pain-free. The bad guys may want my card details for fraud, but what could be far more valuable and damaging is access to my device, its apps and the data they hold. Enterprise data, customer data, personal data. Mobile malware, i.e. malicious software that is designed specifically to target mobile device systems such as a smartphone or tablet, is predicted to rise to its highest level in 2018, and Gartner say that only 30% of businesses will have a mobile threat defence strategy come 2020.
When you couple with this with the fact that businesses are opting for a mobile first strategy, you see a worrying lack of broad awareness or widespread take up of initiatives to introduce adequate controls. Something you’d never do with any other endpoint. If I’d added my new card details, there is a good chance I could have been compromised further –‘Thank-you Mr H’, ‘Download our new app Mr H’ – and suddenly there is mobile malware on the device. You might think ‘only a fool would do that’, but we’ve been here before right? The human factor will always be a weak element of your cyber protection strategy, and given the ease of use of mobile, it’s the next threat vector to be dealt with.
So whether it’s dodgy app stores, suspect public Wi-Fi, or SMS phishing, there’s a good chance that where you thought you had mail, you’ve actually got malware.
But we can help. From secure mobility solutions to help with encryption, authentication and mobile device management, to Next-Generation Firewall to support intrusion prevention and malware protection, you can combine your in-house resources with our expertise to build a comprehensive security portfolio.
We also offer a malicious apps test.  It’s free, simple and has had a 100% success rate. Which might sound like a bold claim, but of all the enterprises we’ve worked with who took the test, we found mobile malware was on all of their devices. I wonder what it’s doing, don’t you?
Now. Back to the TV and Facebook.
Lee Hargadon
Head of Enterprise Mobility, O2
This post was published on April 7th in businessblog.o2.co.uk 

#CyberSecurityPulse: Monero and EternalRomance, the perfect formula

ElevenPaths    1 May, 2018
social networks image

Last year’s release by ShadowBrokers about tools belonging to the National Security Agency continues to be a talking point. A new malware which utilizes the EternalRomance tool has appeared on the scene along with Monero-mining. According to the FortiGuard of Fortinet laboratory, the malicious code has been called PyRoMine as it was written in Python, and it has been discovered for the first time this month. The malware can download it as an executable compiled file with PyInstaller, thus, there is no need to install Python in the machine where PyRoMine will be run. Once installed, it silently steals CPU resources from the victims with the aim of obtaining Monero’s profits.

“We do not know with certainty how it gets into a system, but taking into account that this is the type of malware which needs to be widely distributed, it is safe to assume that it gets in through the spam or drive-by-downlod” said the security investigator from Fortiguard Jasper Manuel. In a worrying way, PyRoMine also configures a predetermined hidden account within the infected equipment through the system administrator’s privileges; utilizing the password “P@ssw0rdf0rme”. It is possible that this is utilized for reinfection and other attacks, according to Manuel.

PyRoMine is not the first miner to use these NSA tools. Other investigators have discovered more malware pieces which utilize EternalBlue for cryptocurrency mining with great success, such as Adylkuzz, Smominru and WannaMine.

More information available at Fortinet

Highlighted News

The government of the United States and United Kingdom allege that Russia is behind the increase in attacks to their network infrastructure.

anti-doping imagen

In the first statement connected to this, the United States cyber-security authorities have issued a technical alert in order to warn users of a campaign being carried out by the Russian attackers who attack the network infrastructure. The targets are devices at all levels, including routers, switches, firewalls, network intrusion detection systems and other devices that support network operations. With the access which they have obtained, they are capable of masking themselves as privileged users, which permits them to modify the devices operations so that they can copy or redirect the traffic towards their infrastructure. This access also could allow them to hijack devices for other purposes or to shut down network communications completely.

More information available at US CERT

Facebook: “The company will comply with the new privacy laws and offer new privacy protection for everyone, no matter where you live”

EI-ISAC imagen

So Facebook has announced their latest steps taken in respect to user privacy, with the aim of granting themselves more control over their data as part of a General Data Protection Regulation (GDPR) from the EU, this includes updates of their terms and data policy. In this way, everyone, regardless of where they live, will be asked to review important information about how Facebook uses data and about their privacy. The topics to be reviewed will be about ads based on data from members, profile information, facial recognition technology, presentation of the best tools to access, delete and download information; as well as certain special aspects for the youths.

More information available at Facebook

News from the rest of the week

Attackers take advantage of an error which Internet Explorer did not correct

They have identified that a 0-day in Internet Explorer (IE) is utilized in order to infect windows’ computers with malware. Qihoo 360 investigators confirm that they are utilizing it at a global scale by selecting targets through malicious Office documents loaded with what is called a “double-kill” vulnerability. The victims should open the Office document, in which will launch a malicious web page in the background to distribute malware from a remote server. According to the company, the vunerability affects the latest versions of IE and other applications that use the browser.

More information available at ZDNet

The release of an exploit for the new Drupal error puts numerous websites at risk

Barely hours after the Drupal team would publish the latest updates, they corrected a new remote code execution error in their system software from the content management; the attackers have already started exploiting this vulnerability on the Internet. The newly discovered vulnerability (CVE-2018-7602) affects the core of Drupal 7 and 8, and allows the attackers to remotely achieve exactly the same as what they would have discovered before in the error of Drupalgeddon2 (CVE-2018-7600), allowing them to compromise the affected websites.

More information available at The Hacker News

Firefox 60 will support Same-Site Cookies in order to avoid CSRF attacks

Last week Mozilla announced that the next version of Firefox 60 will implement new protection against Cross-Site Request Forgery (CSRF) attacks, providing support for the Same-Site cookie attribute. The experts will introduce the Same-Site cookie in order to prevent these types of attacks. These attributes can only have two values. When a user clicks on an incoming link in ‘strict’ mode from external sites from the application, they will initially be treated as ‘not logged in’, even if they are logged into the site. ‘Lax’ mode is implemented for applications that may be incompatible with strict mode.
In this way, the cookies from the same site will retain in the crossed domain’s sub-requests (for example, images or frames), they will send it provided that a user navigates from an external site, for example, by following a link.

More information available at Security Affairs

Other News

152,000 dollars robbed from Ethereum after compromising an Amazon DNS

More information available at SC Magazine

What are the new Gmail functions?

More information available at Google

An error in a Linkedin plugin allows third parties to obtain information from the users

More information available at The Hacker News

The new Bezop cryptocurrency filters personal information from 25 thousand users

More information available at Security Affairs

Are you Ready for a Wild World? Don’t miss out on Big Data for Social Good 2018!

AI of Things    30 April, 2018
Ready for a Wild World? Our next Big Data for Social Good event will be dedicated to Climate Change and Disaster Preparedness

Although we often associate Big Data with worries such as security and privacy in our daily lives, it’s also important to highlight the enormous potential that data offers when it comes to the quality of peoples’ lives. This is what we call “Big Data for Social Good”

When we start to look into it, the data speaks for itself! Currently, there are six billion mobile phones in the world and 80% of them are found in developing countries. This offers us an interconnected network with an incredible potential to generate valuable information. Thanks to anonymized and aggregated data, this allows us to:

  • optimize resources
  • reduce CO2 emissions
  • create poverty indicators that help us to understand the economic challenges in developing countries
  • efficiently manage natural disasters
  • take on the biggest challenges that humanity faces
As such, the possibilities are endless! In this new digital era, decision-making based on data is a fundamental pillar of successful organizations. Using macrodata for social goals (Big Data for Social Good) allows us to do our bit to help improve our environment, but also to build a society that is more fair and sustainable. In this way, at Telefonica we are committed to giving back the value of data for society’s gain. To do this, we have chosen to use our own data, alongside external data from private and public companies, to drive progress and guarantee a better future.
Telefonica is fully committed to achieving the Sustainable Development Goals by carrying out a number of projects and initiatives that positively impact our society.
Ready for a Wild World - Big Data for Social Good 2018
Figure 1: Ready for a Wild World – Big Data for Social Good 2018
    
Big Data can truly be a catalyst for change and can contribute to the majority of the Sustainable Development Goals set by the United Nations. These goals aim to guarantee a more equitable and environmentlally-friendly development, with special focus on reducing the human-caused dangers of climate change and reduce extreme poverty.
The ability of data to achieve this goes much further than isolated projects where data plays a key role. We can improve agricultural productivity (Objective 2), traffic management and mobility control (Objective 11), improve business efficiency (Objective 9) and control the spread of diseases (Objective 3). Data can help us achieve each and every goal, by allowing us to analyze the current performance and improve decision making at both a business and national government level.
International organizations have already realized the potential of the data economy for the common good. This year at the Mobile World Congress, GSMA launched the “Big Data for Social Good” initiative with the objective of strengthening the collaboration between mobile operators in order to use their data to predict and manage global crises, such as epidemics, contamination or natural disasters. In the same way, we are working on projects with organizations such as FAO and UNICEF, where the deep analysis of data contributes to preparing for natural disasters and the effects of climate change.
Currently, there is a general consensus that Big Data for Social Good should be treated as a collaborativ tool where private and public bodies that data in order to generate social benefits. In fact, the 17th Sustainable Development Goal is “revitalize the global partnership for sustainable development“. There is special importance for those alliances that share data of diverse types (mobile, financial, satellite images etc) and that incorporate the agencies that will use the tools generated. In this way, a valuable cycle is created where the providers of data and analytics design the solutions alongside those who demand them. Another fundamental aspect is development of sustainable initiatives over time. Initiatives should include a viability plan over medium and long-terms, thus going further than the reach of “Proofs of Concept”, and should guarantee the availability of the service for those who use the tools (humanitarian organizations and governments).
A year ago we celebrated our first event where we debated and explained the problems and opportunities of Big Data for Social Good. We were joined by top-class speakers from different global organizations such as UNICEF and BBVA, who showed that the use of macrodata to make the world better is no longer an idea, but a reality.

This wear we take on the challenge once more and will be debating the use of data in order to take on the challenges of climate change and to prepare for natural disasters which are themselves often caused by climate change. We have designed a schedule that includes speakers from global organizations such as GSMA, FAO, Data-Pop Alliance and DigitalGlobe, who will share their first hand experiences of the problem with a particular focus on data-based decision making. For Telefonica’s part, we will delve a little deeper into one of the fundamental challenges in many parts of the world; connecting the unconnected. The event will be made up of a series of 30 minute talks in which each speaker will show us how their organization has taken on the challenges. It will conclude with a panel discussion in which we will share ideas about the sustainability of these types of initiatives.
The event will take place on the 24th of May at the Espacio Fundación Telefonica, location at Calle Fuencarral 3, Madrid. The event will also be available via streaming for those who are unable to attend in person. We look forward to seeing you!
You can keep up to date with all the latest news on the event’s website!

Facebook changes the logic of their TLS policy (partly due to our research), by implementing a ‘two-way’ HSTS

ElevenPaths    30 April, 2018
Facebook and privacy. The recent scandal from the social network within the last few weeks does not exactly make it the best example in regards of privacy or secure connections in general. Yet, this is not the issue now. It is certain that it has been the first website (or rather, ‘platform’) to take a very interesting and innovative step in the TLS renewal policy, which the internet has seen within the last few years. Which involves the reinforcement of the TLS concept in general on all fronts: “TLS Everywhere”, free and accessible certificates, HSTS, Certificate pinning, Certificate Transparency, in order to set aside the old protocolsThis is a deep revision of the ecosystem in which Facebook (and Instagram) unite together with a more than interesting proposal.
You already know what HSTS is all about… the server sends a header to the browser in order to remember that the redirection of the HTTP and HTTPS must be done ‘locally’ (through a redirect type 307), omitting the danger from a network abduction. The web which provides this header, should obviously, be available for HTTPS, and guarantees a minimum good practice with the authentication and encryption which TLS provides. So far, so good, we have talked about this issue a few times, but what if we turn the tables? This is what they thought from Facebook; therefore, they ended up with a more than interesting concept in order to improve overall security, which could be imitated by other platforms.


HSTS has some gaps
In its official security blog, Facebook announced a security update a few weeks ago from the Facebook links. So what did it consist of? In Jon Millican’s post (an engineer from Facebook’s data privacy team) he introduced the HSTS concept and following on from this, he announced a series of known HSTS weaknesses (they come as standard with the mechanism, practically), which they were going to try and cover up with this new approximation, which we can see here:

  • Not all of the browsers support HSTS: although it is certain that the large majority of them do. It still is not a very strong argument, but it has some standing.
  • The Preload is not so dynamic: of course, the preload is there to cover this ‘TOFU’ (Trust On First Use) gap which is the Achilles’ heel of HSTS. This first connection with a site, which is carried out in clear text, because they still have not sent the first HSTS header. This ‘preload’ list is embedded in the browsers, and it is certain that it will not result as dynamic as it should be. It is managed by Google, but many people use it and it is updated within the browser versions.
  • Not all of the browsers implement HSTS how they should. Here they reference our research which was presented in the Europe Black Hat 2017, which demonstrated that Chrome, Firefox and Internet Explorer manage HSTS and HPKP in a questionable manner and also which assumes a problem which they try to resolve with a proposal.
Facebook mentions our research as part of their argument to implement this improvement

With these arguments at hand, they proposed a solution from their side. What if they are the ones in the almighty position, who add the “S” to any HTTPS links to other sites on Facebook and Instagram?

HSTS… in both directions.

Many people ‘live’ within these webs, and when they visit something, it goes from there and towards another bugged domain in the links which Facebook ‘accommodates’. Their precise idea is that Facebook adds ‘S’ to the protocol, even if the user who wrote it and is linked to it, did not do so. Thus, what they have decided is the following:
  • In order for all of the domains presented in Facebook and Instagram to be ‘bugged’ by a user, and furthermore found in the official Google ‘preload’ list, they will add an ‘S’ so that it can be browsed in a safe way. Thus, they cover up potential users with a deactualized list or they use a browser which does not support it.
  • They will “crawl” the web in general by themselves in search of sites which provide HSTS. If they are sure that they can be trusted (we do not know how), they will add more and more domains each time to their list, to add them from their own servers, the “S” and those users who click on it do not depend on their browser to benefit from a HSTS from the Facebook platform.
In summary, a reverse HSTS which compliments potential mechanism gaps, should maybe imitate others by their simplicity in relation to their potential advantages. To work from the point of view of a platform purely in the server, as a result of something maybe intrusive but useful in the context of Facebook and Instagram, due to their diverse user profiles and their popularity. This laudable initiative was tarnished shortly after its announcement by the Cambridge Analytics scandal.


HSTS… for everyone

In regards to filling the gaps that HSTS could leave, let’s not forget that Google has already taken a very interesting step in this direction. In addition to everything we already know, Google is also a top-level domain registrar… as for example.gle, .prod, .docs, .cal, .soy, .how, .chrome, .ads, .mov, .youtube, .channel, .nexus, .goog, .boo, .dad, .drive, .hangout, .new, .eat, .app, .moto, .ing, .meme, .here and so on up to 45. In October, they announced that they will upload the preload list by default to anyone who registers a domain with them. This means in practice that it forces them to implement TLS from the outset since Chrome will access them through port 443 whether they want to or not.
To conclude, we should not forget that this year Google also wants to flag up straight away anything via HTTP as “not secure” (for now it has the words “not secure” in the address bar, but the red cross will also be added in Chrome). Whereby the message would almost cease to exist for the unencrypted traffic; yet it is also an opportunity for certificate and CA creators…

In the end, whichever HTTP link will be marked as not secure

New PinPatrol versions

Of course, speaking of HSTS, we have new PinPatrol versions for Chrome and Firefox; where you can control the HSTS and HPKP entries better from the browsers, also with usability and compatibility improvements.

Sergio de los Santos
Innovation and Laboratory
@ssantosv

The benefits of energy efficiency: Much more than savings

Beatriz Sanz Baños    27 April, 2018

Energy efficiency has become the ‘first fuel’ of the 30 countries that belong to the International Energy Agency (IEA), including Spain. This means that the energy saved by the members of this organization was higher in 2010 than the energy demand met by any source of energy, including oil, gas, coal, electricity or any other fuel. 

Energy efficiency is a key lever in achieving the sustainability objectives which require lowering kT emissions of CO2 equivalent. Thus, the IEA modelled that 40% of the reduction in emissions needed to limit the increase in the global temperature to 2 degrees by 2050 could be achieved thanks to energy efficiency. 

These figures endorse the additional benefits of energy efficiency, which are joined by other obvious advantages like savings for companies and industries. They are all part of the concept known as the ‘multiple benefits’ of efficient energy management, which was addressed by the IEA itself in a workshop held in Paris last March, where it updated and reflected on its progress. 

This concept, which is still little-known, was presented in a 2014 report entitled ‘Capturing the Multiple Benefits of Energy Efficiency’, which described how investment in energy efficiency benefits the different stakeholders, identifying 12 key areas with a positive impact due to energy efficiency, including energy savings. 

This list of advantages also includes environmental sustainability, active values, macroeconomic development, industrial productivity, energy security, access to energy, the cost of energy, public budgets, the available income, air pollution, and health and overall wellbeing. 

Different kinds of solutions 

Tools of this nature can be grouped into two kinds: remote metrics and remote control. The former primarily consists of implementing IoT sensors in the client’s facility which generate information on consumption and the variables on which it depends (outside temperature, inside temperature, humidity, etc.), which are then transmitted via mobile or stationary networks to a cloud platform which stores and processes it and provides a visualization environment. The latter add the deployment of actuators, which are managed remotely from the platform to allow for dynamic configuration and therefore achieve better optimization of consumption. Smart Energy IoT by Telefónica is an example of a specific solution to manage energy efficiency through the application of the IoT. 

In short, by focusing on energy efficiency we get a threefold benefit, since it guarantees savings, sustainability and digitalization or “IoTization”, so it is a solution worth bearing in mind for companies and industries in all sectors.