Case Study: LUCA Tourism and Royal Palace Visitors Analysis

AI of Things    19 June, 2017
Madrid receives almost 6 million international tourists annually, who come to the city to see the history, soak up the sunshine and experience the culture. In addition to this large group, a significant number of national tourists from other areas of Spain also frequently take trips to Spain’s capital. The large number of visitors present a great opportunity to leverage mobile data to optimize tourism planning.

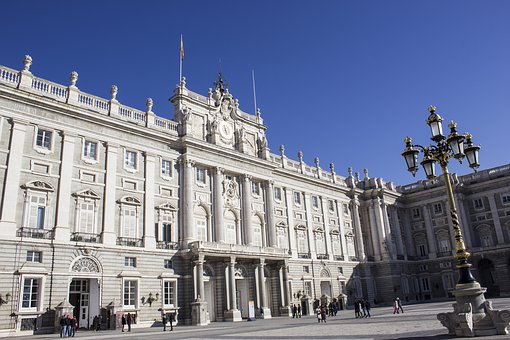
For these tourists, one of the top Madrid destinations in the Royal Palace. This stunning 18th-century palace is the official residence of Spain’s royal family, although it is primarily used for state dinners and other official visits. It is also open to the public, who can tour certain rooms and visit rotating art exhibitions.

Watch the video below for an example of a recent Royal Palace art exhibit:

Patrimonio Nacional is the governmental agency tasked with managing and maintaining the beautiful estate, and other royal sites. In order to balance their need to preserve this important historical site with the need to create a positive visitor experience, Patrimonio Nacional partnered with LUCA to get better visitor data. Through our LUCA Tourism product, we were able to help Patrimonio Nacional understand the behavior of national and international tourists during the Christmas period of 2014 and 2015. They were also able to compare tourist profiles between their attractions and other prominent tourist hotspots. This information helped the agency make better data-driven decisions about to plan for tourist patterns.

To learn more about LUCA Tourism, visit our website.

The Intelligent MSSP

ElevenPaths    15 June, 2017
During years, Managed Security Services (MSS) have been the most effective strategy to tackle the increasing and changing threat landscape. Otherwise, some disruptive factors are compelling a new approach for corporate information security. Specifically, we refer to technology factors, such as the blurring of the organization’s boundaries or the explosive growth advanced threats, operational factors like the increasing complexity of the organizations processes and business ones, for instance, the compulsory requirement of implementing an efficient risk management to invest the precise budget in security, no more, no less.
How to address these requirements keeping in control the complexity of a Managed Security Service?
This article identifies which are the compelling factors and proposes a layer-framework for MSS that ensure the right coordination among technology, operation and business to protect the organizations of the future.

Gartner defines Managed Security Services (MSS) as “the remote monitoring or management of IT security functions delivered via shared services from remote security operations centres (SOCs), not through personnel on-site”. Most players in the security business consider MSS as the most efficient approach to manage the corporate security for any kind of organization, and consequently, it is increasingly common, organizations turn to MSS Provider (MSSP) to delegate day-to-day security management, monitoring and remediation, so they can focus on their business core. Thereby, everybody agree security outsourcing implies cost savings, expert management and productivity improvement.

Compelling factors by pushing the MSS evolution

Over the past few months, analyst, security providers and customers have warned about some compelling issues that are forcing a redefinition of Managed Security Services and, subsequently, a reconfiguration of the market players. Three categories comprise these factors, namely: technological, operational and business. Within technological category, the blurring of the organization’s defence perimeter, the explosive growth in advanced threats all over the World and the fact that attackers are changing their elusion tactics just as quickly as corporations implement fences are the most relevant components. Regarding operational issues, the main handicap to address is the increasing complexity of the organizations processes (IT and OT). Finally, business factors, the most recent, are perfectly summarize in the principle of business continuity above everything. There is no doubt; day-to-day reality has proved there is a necessity of evolving to keep ensuring successful protection.

The Four-Layer-Framework for MSS

The Four-Layer-Framework aims to isolate –for the sake of simplification– the Managed Security Service into four intervention areas, through which to achieve a straightforward understanding of the customer needs and future challenges, facilitate the incorporation of the newest protection technologies and analytic processing, standardize the operation process from SOCs and put into service a security for the business. From bottom to the top, these are the layers:

  • Operational layer: process, people and tools in charge of the operation and automated response. We refer what some analyst have come to call the Intelligence-driven Security Operational Centre (ISOC). ISOC includes the capabilities of the previous ones –device management, security monitoring– and the distinctiveness of itself –data-driven security, adaptive response, forensic, post-analysis for threat intelligence and dynamic risk management. This operational layer and specifically the SOCs should fulfil the current recommendation directives from relevant advisory firms. We refer, for instance: operate as a program rather than a single project; full collaboration in all phases; information tools adequate for the job, providing full visibility and control; implement standardize and applicable processes and to conclude, and maybe the most important, an experienced team with the adequate skills and a low-rotation level.
  • Technology layer: this level comprises the technology pieces that are in charge of the specific security prevention and protection, from on premise firewalls to security services such as Clean Pipes over Next Generation Firewall or CASBs. The originality of the proposal is to represent them as isolated elements that requires from the backbone capabilities to be part of a MSS offering. The main backbone capabilities included in the layer are the interaction modules, which act like a collector to transmit events to the rest of the levels and an actuator with the responsibility to trigger the response in form of policy management.
  • Analytic Layer: this layer is associated to the brain of the whole system, the element in charge of the massive event processing which allows the data-driven security. We refer to the big data analytics platform to uncover hidden attacks patterns and carry out advanced threat management and response. Additionally, analytic layer includes some backbone capabilities such as cross calculation of KPIs for general security status, real-time risk management meter, event collection and storage and threat intelligence prosumer.
  • Delivery Layer: level on top concerns how clients consume the managed security, with direct implication in customer service perception. This layer comprises unified visibility and control and the real-time risk management and compliance. We compact everything under the layer of Business Security. Not only does security a technology issue or an exclusive area for IT departments, but also it is becoming a relevant factor of the business performance of the organizations. There is a great consensus about the need of increasing implication of business areas and boards in security matter, and for them is not valid a technology language but a business language. This layer makes understandable and actionable the security information for business and C-level. Then, some important element is the integral security portal and the included dashboards, with the precise granularity to satisfy the different organizational roles, security as a glance, real time risk level and SLAs performance for boards or specific day-to-day incident and threat intelligence information for experts security analyst.
According to these principles, we have built SandaS, the Telefonica´s MSS platform, including an specific components to provide the backbone functionalities in each layer.

SandaS RA (Automatic Response) is the module that makes possible the response from the Telefonica’s SOCs all over the world. It is in charge to trigger the mitigation and to facilitate the security experts to resolve incidents. SandaS RA is deployed in each SOC and includes contextual categorization of alarms, integration with ticketing services and customer ticketing, automatic response over security equipment and notification services.
SandaS CA (Alerts Collector) is in charge to collect and normalize alerts from security equipment –on-premise or cloud-, SIEMs and security protection services, as well as to gather the raw events to feed our Data Management platform.
SandaS PA (Analytic Processing) represents the brain of SandaS. It performs two main functionalities. On one side, the generation of real time security KPIs according temporal evolution and other configurable filters. This is a very strenuous work since SandaS PA have to cross-process millions of events in milliseconds, which is only possible with a refine architecture design. On the other hand, the analysis –based on machine learning and other advanced correlation mechanism– over raw events for multiple sources to uncover advanced threats that have gone unnoticed to the protection services. Additionally, SandaS PA includes mechanism to interact with IoCs sources, as well as generate IoCs from the analyzed threat activity.
SandaS Portal, the piece through customers consume MSS and perceive the benefit provided for the platform. It includes security status and performance dashboards, risk management and compliance tools and other useful mechanism to interact with the rest of the layers.

Conclusion

A MSS is a complex ecosystem, where different technologies, providers, professionals and operational models live together; sometimes without getting on well. Thereby, it is compulsory a backbone element to conduct the orchestra in the interpretation of the stunning symphony. In our understanding, this is the role of the MSS provider, being able to coordinate the multiple players of each layer and to standardize an interaction with the rest of ones in the upper or lower layers. How to get this objective? In our understanding, we think it is about people, process and tools. Nothing new, or maybe yes.

Francisco Oteiza Lacalle
Global Product Manager in Managed Security
@Fran_Oteiza

Case Study: LUCA Store and DK Management, driving footfall and increasing convertion

AI of Things    14 June, 2017
In case you didn’t already know one of the many products from our business portfolio is LUCA Store. This post will take a look at our collaboration with DK Management and how they worked with our Big Data and Advertising team in Ecuador.

DK Management was created to provide their clients with a top class management and operation service for various shopping centres across Ecuador. They offer over 20 years of experience managing succcessful shopping centres. They have been using state-of-the-art technology to further their orgaizational processes and further improve the perfomance of their staff.

LUCA provided an integrated solution which used three customer data collection tools. We firstly provided mobile insights to obtain information regarding the mobility flow in the various cities throughout Ecuador. We then used 3D counters to identify people who visit each shopping centre as well as an intelligent WiFi solution to locate hotspots within the same shopping centre. The following video shows our client explaining our working relationship:

ElevenPaths and BitSight deliver enhanced visibility into supply chain risk with continuous monitoring

ElevenPaths    13 June, 2017

Security Ratings Market Leader Expands Global Reach with New Strategic Alliance
CAMBRIDGE, MA—June 13, 2017. ElevenPaths, Telefónica Cibersecurity Unit specialized in the development of innovative security solution, and BitSight, the Standard in Security Ratings, have announced a new alliance that will enhance visibility into supply chain risk for Telefónica customers worldwide.
The agreement between ElevenPaths and BitSight provides Telefónica customers with access to the BitSight Security Ratings Platform for security benchmarking and continuous supply chain risk management. This new offer will be part of CyberThreats, 11Paths’ threat intelligence service, delivering:
  • Objective, outside-in ratings measuring the security performance of individual organizations within the supply chain.
  • Comprehensive insight into the aggregate cybersecurity risk of the entire supply chain, with the ability to quickly generate context around emerging risks.
  • Actionable information included in Security Ratings that can be used to communicate with third parties and mitigate identified risks.
Using evidence of security incidents from networks around the world, the BitSight Security Ratings Platform applies sophisticated algorithms to produce daily security ratings for organizations, ranging from 250 to 900, where higher ratings equate to lower risk. Previous studies from BitSight, independently verified by third parties, show that companies with a Security Rating of 400 or lower are almost five times more likely to experience a publicly disclosed breach than companies with a Security Rating of 700 or higher.
“As an organization’s supply chain and network of vendors and third parties grow, so does the risk of a potential breach. For most companies, it is essential that third parties have access to sensitive systems and files in order to effectively conduct business. The challenge is how to continuously assess those vendors’ security practices,” said Nikolaos Tsouroulas, Head of Cybersecurity Product Management, for ElevenPaths. “For the first time, we are offering our customers a scalable solution for continuous visibility into the security posture of their own organizations and their entire supply chain, through BitSight’s trusted and time-tested technology.”
Data from Tacyt, the cyber intelligence mobile threat tool developed by ElevenPaths, will also be integrated into the BitSight Security Ratings Platform for Telefónica customers to enhance an organization’s view into mobile app risks posed in the supply chain.
“Traditional strategies and existing tools for measuring and mitigating third party risk are not designed to address the new and rapidly accelerating stream of constant threats,” said Dave Fachetti, SVP of partnerships for BitSight. “BitSight’s Security Ratings Platform delivers visibility into dynamic risks that are accelerating faster than traditional methods can scale, without being intrusive or resource-heavy. We’re excited about bringing our unique solution to market with such a strong global partner, while expanding our reach around the world.”

» Download the press release “ElevenPaths and BitSight deliver enhanced visibility into supply chain risk with continuous monitoring.

What does it take to become a top class Smart City?

AI of Things    9 June, 2017
The term Smart City is a term that has been coined in recent years following the surge in use of Big Data. At LUCA we have been contributing to helping cities on the path to becoming smart. Big Data has lead to new ways to tackle the problems of climate change, urban overcrowding and an ageing population. One of our intern’s (Cambria Hayashino) has previously highlighted the success in Stuttgart in terms of optimising their public transport system and reducing climate change. Let’s take a look two cities that are already taking function as top class Smart Cities.

Singapore

The sovereign city state is still at the forefront for the use of Big Data in their ability to provide services to their citizens. Sensors throughout the city provide the government with incredible amounts of data which can then be used for initiatives such as parking monitors, efficient lighting, waste disposal and innovative new systems like ‘Tele-Health‘. Singapore has now taken a further step with it’s already high class public transport system by including, interactive maps and wi-fi- even e-books and a swing. All of these steps are with the final outcome of aiming to keep their citizens happy and give them the smoothest public service. The Smart Nation initiative is led by Singapore’s Smart Nation and Digital Government Office is aiming to create a future that is driven by tech-led solutions.

Singapore Smart City
Figure 2: Government initiatives to lead to a tech-led future.

Barcelona

The Catalan capital also offers its citizens a plethora of tech boosted public services. From a bus service that recently debuted a new orthogonal bus network making it faster, easier to use and more frequent, among other features. The bus system also has urban sustainable mobility, reducing emissions with hybrid buses. Alongside the buses they also manage a bicycle sharing system (Bicing) which is a sustainable and economic form of transport, which gives citizens the option to travel short distances without consuming any energy. The installation of smart parking spaces that use light, metal detectors and sensors to detect if a parking spot is occupied has given Barcelona another marker in terms of what it takes to become a Smart City. The access to real time information in the city has given increased urban mobility throughout the centre. We have named merely a few of the ways Barcelona is leading change with technology, let’s hope other cities can adopt ways to make their citizens more happy.
Barcelona as a Smart City
Figure 3: Just some of the ways Barcelona are making smart decisions.
At LUCA we would love to collaborate with more cities to keep innovating with technology and providing solutions so that one day many governments will have a Smart Nation and Digital Government Office. These cities really are pathing the way to the future with their tech-led solutions. Although we have not discussed every step they are taking to provide effective solutions, it is already possible to see that they are more than on their way to becoming a top class Smart City.

Data rewards are the new consumer engagement tool & Gigabytes are the new currency

AI of Things    31 May, 2017

Today’s consumers are fairly savvy about companies selling to them. As they are constantly bombarded with an increasing number of calls to action, these engagement attempts are often viewed as a nuisance at best. Or at worst, they create a negative association with the company in the consumer’s mind.

What if there were a way to create a win-win consumer engagement scenario for consumers and companies? One in which consumers gained perceived benefits from the engagement and companies were able to meet their marketing and advertising objectives.

This is where Data Rewards come in. Data Rewards serve the interests of both consumers and companies, making it an ideal tool to add to any marketing mix.

Essentially, this new tool rewards customers with small amounts of one-time use data in exchange for completing a certain desired action, such as watching video, taking a survey or downloading an app. Similar to a toll-free phone line or offering free shipping, companies absorb the cost of these services in order to pass on a better customer experience to their consumers. In the case of Data Rewards, companies cover the cost of gigabytes of data and then pass those gigabytes along as currency to pay consumers in exchange for taking desired actions. 

This tool is successful because it meets a felt need in key markets, particularly in the LATAM region. Despite high levels of smart phone penetration, which is expected to reach 68% in 2020, only about 48% of users have a regular data plan. The rest of smart phone users rely on a pay-as-you-go plan, which means they are more conscious about their data usage. However, the opportunity for Data Rewards is not limited only to these data-restricted customers. Even users on a data plan are conscious of their data usages, as those plans do not always include unlimited data. 

Figure 2: Despite high smartphone penetration, data access in the LATAM region is inconstant.

In developing markets, including LATAM, over 30% of consumers run out of data each month. These consumers are reluctant to purchase extra data, so they are highly motivated by offers of free data. Data Rewards target this untapped market by offering as a reward the data that these consumers are seeking. 

The motivation factor is evidenced by the high participation rates. A September 2016 Telefónica survey looked at consumer engagement rate with four different Data Rewards-incentivized calls to action: watching a short video ad, filling out a survey, subscribing to a movie or a series and signing up to a newsletter. The study found significant engagement levels in the LATAM market in particular. For example, on average between 65% – 80% of customers in Brazil, Mexico and Colombia engage with all four rewarded offers in exchange for only small amounts of data. 

High levels of engagement associated with Data Rewards also are an ideal scenario for companies. An 80% engagement rate with standard advertising is almost unheard of, even for the most catchy, viral advertisements. Using gigabytes as a currency attracts and motivates customers, which allows companies to meet their objectives. Putting a product or service before more sets of eyes both increases brand awareness and potentially increases sales, particularly as these consumers are likely to view the brand more favorably for rewarding them with what they actually need.

Figure 3: Data Rewards result in higher conversions.

A great example of the success of this tool is Vivo’s use of Data Rewards in Brazil. The company ran a R$ 2 million campaign (about $630,000 USD), which resulted in 330,000 leads generated in 45 days. Users who filled out a form completely were rewarded with data. Furthermore, Vivo gets not only leads through this tool, but is also able to gain more precise information about these leads, particularly if the call to action they are using is a survey. 

The possibilities for using Data Rewards are endless. Companies can choose to target ads based on consumer habits or needs, and also can customize the amount of data offered for specific actions. Data Rewards ads are also able to be customized with unique company branding. The win-win factor of using Data Rewards makes them attractive to companies and customers alike. 

To learn more about how our Data Rewards tool can enhance your advertising efforts, visit our website.

ElevenPaths announces that its security platform complies with the new european data protection regulation one year earlier than required

ElevenPaths    31 May, 2017
  • The European regulations will enter into force in May 2018, when entities that do not comply can be penalized with fines of up to 4% of their annual turnover. 
  • ElevenPaths introduces new technology integrations with strategic partners such as Check Point and OpenCloud Factory, with Michael Shaulov, Director of Check Point Product, Mobile Security and Cloud, who will be the special guest of ElevenPaths annual event. ElevenPaths also works with Wayra, Telefónica’s corporate start-up accelerator.
  • ElevenPaths collaborates with the CyberThreat Alliance to improve and advance the development of solutions that fight cybercrime. 

Madrid, May 31, 2017.- ElevenPaths, Telefónica’s cybersecurity unit, announces that its platform SandaS GRC – the Governance, Risk and Compliance solution – offers a GDPR Privacy module with which organisations are able, from now, to implement a management system that facilitates the adaptation to the new general data protection regulation.  SandaS GRC is one of the three axes of the RGPD compliance solution together with the consulting services and security products and services which represent an integral solution that is developed in the evaluation fields of the compliance, governance, privacy and security. “

The GDPR, aimed at providing citizens of the European Union of the Common Market with greater control over their personal data, will compel European Union companies to comply with this regulation before May 25, 2018. This regulation establishes fines of up to 4% of annual turnover for those who do not comply.
The 4th ElevenPaths Security Day, under the slogan Cybersecurity beats, has been the scene chosen to present the new technological integrations carried out with its strategic partners to help companies combat cyber-attacks against their technological infrastructures.
Strategic alliances

Among the latest incorporations to its program, the unit has announced and explained the added value involved in the integration between OpenNAC technology, from OpenCloud Factory, and Mobile Connect, driven by ElevenPaths, for authentic access to WiFi networks, which uses the telephone number as the user’s double authentication factor.This service uses the SIM card as a secure element to store user credentials and makes use of the mobile operator’s network as a secure channel to access those credentials.

In corporate environments, this authentication method is ideal for managing guest user access and personal business user devices.

Given the complexity of controlling all the apps that brands develop, publish and distribute in market stores, ElevenPaths has introduced mASAPP, a proprietary technology that provides a real-time view of the security status of companies’ mobile apps.
Moreover, the event has been attended by Michael Shaulov, Director of Check Point Product, Mobile Security and Cloud, and one of the leading experts in the mobile security ecosystem, who has presented the technological integration of SandBlast Mobile with Tacyt, which is an ElevenPaths’ cyber-intelligence tool that fights threats in the mobile world.
ElevenPaths continuously seeks to create and find the best security solutions for its custommers and supports collaborative initiatives in the security industry that allow faster progress in the fight agains cybercriminals. For this reason, in 2015, ElevenPaths joined forces with other leading companies from the industry, such as Check Point, Cisco, Fortinet, Intel Security, Palo Alto and Symantec, and became part of the CyberThreat Alliance (CTA), a non-profit organization, which aims to improve the early detection of threats and their prevention to better protect clients of the members of the alliance, at the head of which is the former coordinator of White House Cybersecurity, Michael Daniel.

Furthermore, ElevenPaths and the CyberThreat Alliance have strengthened their commitment to fight cybercrime, working together, completing and expanding the image of attacks, providing better protection against major global attacks as well as targeted threats.

ElevenPaths has also launched for the first time this year a session in collaboration with Wayra Spain – the Telefónica Open Future accelerator – in order to find the most disruptive solutions in this area, as well as to provide continuity to other security-focused entrepreneurial initiatives, invested in by companies including 4iQ, Logtrust and Countercraft.

ElevenPaths continuously seeks to create and find the best security solutions for its customers and supports collaborative initiatives in the security industry that allow faster progress in the fight against cybercriminals.

» Download the press release “ElevenPaths announces that its security platform now complies with the new european data protection regulation.

More information:

Machine Learning to analyze League of Legends

AI of Things    25 May, 2017

Written by David Heras and Paula Montero, LUCA Interns, and Javier Carro Data Scientist at LUCA

When League of Legends was released in 2009, few people could have predicted what was to follow. The undeniable increase of eSports has been led by the ever-popular platform produced by Riot Games.
The last benchmark that was made public by the creators indicated over 100 million monthly users. These figures have given League of Legends the top spot amongst the MOBA (Multiplayer Online Battle Arena).
We will firstly examine the market before the huge success of LoL and it’s competition. For those who are unaware of how the game works, the classic version of the game consists of two teams of five competitors aiming to destroy the base of the competition whilst defending their own.
Then we will dig a little deeper. We have set out to characterize the team play and predict the results of some of the professional matches that will be played in the future. 
We have based our insights on data published by Tim Sevenhuysen using Oracle’s Elixir. This data set includes information on each competition (both on an individual and group level). The data covers all facets of the game including: gold obtained, damage caused, and “farming.” This data set forms the foundation of our analysis.

Data and Planning 

Our analysis uses data taken from 7 different leagues that were distributed worldwide with the results of each game. What we are trying to predict for future games is whether it will be a victory or not using a simple data classifier. 
We have used statistics from the 2017 Spring Split, which started with an extensive data set. We have access to the all the variables (player, winner, team, gold, damage etc.) from each match which is then further divided per team and finally per player from the ten from each team. 
After testing various ways to approaching the analysis of the data, this is what we have come up with:
  1. Completing a non-supervised classification of each team through grouping variables thematically: Gold, CS (“farming”), Wards, Objectives and KDA ratios.
  2. Add the trends for victory of the team for their last five matches, taking into account whether they play on the blue or red side.
We will use unsupervised learning to characterise the teams from each game and supervised learning to make the prediction for future matches.
Supervised learning becomes potent when the model is trained and knows the classifications that we previously stated. When predicting new results, the classifier knows what happened previously on similar occasions and will, therefore, predict on the basis of that information and the internal structure of the algorithm.
  • Team Data:
We had the option to work with individual information of each player. However, we decided to work with team data to avoid the problem of player substitution and changes. By focusing on the joint result of each team we know that we may be losing some information, however, we avoid the previously stated problem that could arise.
  • Data Gaps:
Occasionally there are members who have information that varies from the other team members. Data that has problems or that is left blank does not give us any information to work with. By carrying out several tests we have verified that the solution that gives us better results is to replace those cases with the average of the corresponding variable. This means we will not lose any information from the registered players.
  • Redundancy:
By carrying out a simple correlation analysis we can see that there are quite a few redundant variables, that give us repetitive information. For example with more CS, Gold won or more experience when looked at with comparison to the adversary, it is almost always translated into victory. As these three variables all give us the same outcome (positive) it is sufficient for us to use only one with our analysis, we will find out which one a little further on.
  • Temporary untagging: 
This is an important point to highlight as the duration of a game strongly influences the obtaining of gold, CS, experience, KDA and more. If we were to ignore this variable, we would be negatively affecting the data models. For example: the best Korean team could have won a match in 20 minutes having only recovered 20,000 pieces of gold, whilst the worst team in Turkey could have lost a game lasting 60 minutes while recovering 25,000 pieces of gold per player. At first glance, it would appear that the Turkish team had performed better in terms of gold, but this is not a valuable data source since the Korean team recovered 750 pieces of gold per minute compared to the 416 pieces by Turkey. This is a significantly different figure once a more in-depth analysis is performed.

Characterising the teams

After having optimized and prepared the data, we can continue to carry out the team classifications. We have used the non-supervised classification method by Kmeans which includes the Sklearn library from Python. This algorithm will analyse the teams according to the previously selected facets of the game and will then classify the teams according to their behaviour. Non-supervised classification means that there has been no previously signed classification. The outcome that we hope to achieve will see the algorithm putting the best and worst from each league together. 
The groups of variables that are mentioned above usually have more than three variables, in order to produce a scatter for the results we have reduced the size of the data set to only have two dimensions. This will make each variable part of the axis, in order to carry out this operation we apply the Principal Component Analysis from the Sklearn library of Python. 
Once we have carried out the PCA we then classified the teams using the non-supervised method. We used Spotfire to visualize the results.
The following insights are what we consider to be the most notable from the visualization:
  • The teams with the best results tend to group together in the clusters. The same pattern is noted with the teams with the worst results. This means that the algorithm effectively classified each team despite the loss of information with the reductions of the dimensions of the PCA.
data visualization
Figure1: Highlighting the teams with a lower ranking in the competitions to see how it coincides with the data clusters.
Figure2: Highlight the teams with the highest rankings to see how they coincide with the data clusters.

  • There are some rare cases like the EnVyUs (they finished last in the North American league) that when looked at through the CS or Gold recovered categories they are amongst the best of their league like the SoloMid team. However, in all of the other areas that were analysed (KDA ratios and Objectives), they maintained their position as one of the worst teams amongst the other leagues.
data visualization
Figura 3:  The special case for the EnVyUs team, as they were part of the best teams with regards to CS.
Figura 4: The special case of EnVyUs, this time amongst the worst cluster in terms of gold.
  • It should be noted that in the case of some leagues, their participants remain close. In the North American league, the teams stay close in all areas analyzed. This trend does not seem to happen in the European or Turkish leagues.
Figure 5: Measuring the proximity of teams that play in the same league.
The information that has been generated about each team through these clusters will then form part of the dataset for the training of our prediction model. In fact, according to the tests we did, the results of the predictions using simply this information were not completely wrong: we obtained a precision of accuracy between 58% and 60% with different models. We still have the capacity to enrich the information to improve this result.

Trends

After having read several articles and studies relating to predictions made in other traditional sports, it becomes apparent that it is also important to take into consideration the form of the team upon arrival at its next match. As always there are various ways to include this information, this is what we decided to do: 
We have differentiated whether the team plays on the blue or red side, this is because we know that this is a factor that greatly influences the results of the games. However, this differs depending on the current patch of results at that time.
We have also concluded that the form of the team can be a decisive factor, so we calculate the winning streak that each team has in their last five games. 
In order to calculate the trend for a team, we keep track of 5 games that are played in chronological order and the result of each one. This allows us to keep track of their form before they reach the next game.

Final Dataset

After fine-tuning the data, the model will include the following information:
  • The teams who will compete against one another
  • The clusters refer to a group of variables that each team belongs to based on their number of games played.
  • The winning trend in the last five games played by the blue team as a blue team.
  • The winning trend in the last five games played by the red team as a red team.
The following table is a small example of the final format for the data.
Figura 6: An example of the final data format.
For example, in the first game shown in the table, the team “Unicorns of Love” has a trend equal to 0.6, this leads us to conclude that at the time of facing “G2 Esports” they had won three of their last five games played on the red side. It also includes the cluster in which all teams appear with each type of variable. The “Blue Victory” column is used to train the final model and we will delete it for testing.

Results

At this point, we have the data ready for the next step, training and evaluating our prediction models.
As a previous step, we can discretize (using Sklearn´s LabelEncoder library) the names of the teams or use dummy variables.
In addition, when evaluating the efficiency we have used cross-validation to ensure that the precision of results from each model are independent of the partition taken between training and test data.
The successful results that were obtained are the following:
To make our model more of a reality, we took advantage of the fact that there was a tournament ongoing while we were carrying out this study. We wanted to do some real tests to see if the results obtained in the simulation match the real ones. (MSI)
We made predictions for the games played in the first three rounds of the group stage, and the most accurate model in the actual evaluation was the SVM which gets 68.75%. This result was higher than expected.

Miércoles 10 de mayo de 2017
vs
vs
vs
vs
Acierto
Acierto
Acierto
Fallo


Jueves 11 de mayo de 2017
vs
vs
vs
vs
vs
vs
Acierto
Fallo
Acierto
Fallo
Acierto
Acierto

Viernes 12 de mayo de 2017
vs
vs
vs
vs
vs
vs
Fallo
Acierto
Acierto
Acierto
Acierto
Fallo

Special Case

We have noted a rather curious fact, that when the prediction has failed either G2 Esports or Flash Wolves participated in a match against another team or against each other.
As for G2 Esports, anyone who follows the European scene knows that G2 Esports always goes the international championships with high expectations, and from the predictions, if SKT T1 participate they will help them reach the title. They are the clear kings of Europe and their style of play is so clean and unpolluted that it almost seems unbelievable when they leave Europe that their success becomes a lie. It has not been until this very MSI that G2 have been able to redeem themselves and against many predictions has managed to reach the final and face the Korean gods. Ocelote´s team finally showed their potential and despite reaching second place, their fans and followers in Europe had a reason to feel proud.
The Flash Wolves case follows a similar pattern. Winner of the LMS, who managed to defeat G2 in the IEM Katowice final and therefore become the champion. This meant that their performance at MSI was hotly anticipated however they were not able to overcome G2 in the group stage. Despite this loss, they were able to win at the SKT. This produced a roller coaster of feelings amongst fans, who had arrived the semifinals with some hope. It was short lived as they were defeated decisively 3-0 in a best of five series.
The prediction in the games surrounding these two teams was difficult for any fan. As we have seen all kinds of results were produced.

data visualization
Figure 7: Cluster representations for both G2 (circle and Flash Wolves (triangle)
Figure 7 highlights the two different teams. As we can see, both are neck and neck, which indicates that they have a similar performance. Taking into consideration all factors that form the analysis we could say that they are both good teams. However, if we take a closer look, we notice that in the CS graph, G2 marches ahead. Not only in comparison with Flash Wolves but also with the other teams that are featured. Flash Wolves also march ahead in the gold and objective graphs. With a deeper analysis, we can then see that the two teams are not as similar as first thought.
This is as far as we have went with our analytical experience of LoL using ML. As it is often the case when concluding an analysis, many developments continue to emerge that would surely improve the results. This is precisely because of all the knowledge of the domain that you have acquired through the process of research and all the ways in which we analysed the data. It is apparent that amongst the data science boom, “Sports Science” is a branch of activity that is also increasing with a bright future ([1] [2] [3] [4] [5]).

A World-Changing Combination: Dr. Claire Melamed on Big Data, Collaboration and the SDGs

AI of Things    24 May, 2017
big data for social good

Dr. Claire Melamed is the Executive Director of Global Partnership for Sustainable Development Data (GPSDD), where she leads efforts to collaborate on leveraging data to meet the UN’s Sustainable Development Goals. In 2014, she was seconded to the UN Secretary General’s Office to be the Head of Secretariat and lead author for “A World That Counts,” the UNSG’s Independent Expert Advisory Group on The Data Revolution. 

We had a chance to sit down with Claire to discuss her work with Big Data and the SDGs, and why collaboration is crucial to meeting these important goals. Telefónica is proud to be a collaborator on this project, and we also discussed the specific role that telcos can play in this partnership.

So Claire, how important is having mobile data to the GPSDD?


Absolutely critical, as telco data, along with many other new sources of data, have great value and an immediate practical application as governments try to fill the data gaps that limit progress on the SDGs. We’re already seeing some of the valuable insights that using telco data can bring, and it’s really important that this work continues. We’re really excited to work with companies like Telefónica on this and there’s a lot we can do together!
We have governments and others with hugely increasing demands for data as they try to run better services and better meet the needs of their populations. And we’re facing increasing global threats such as epidemics and climate change that have been developing over a longer period of time, where data is also needed to understand and to tackle them. We also live in a world that is producing more data than ever before, through mobile phones and many other new technologies.
At the GPSDD, we try to understand, and to test out in practice, how new sources of data, combined with established methods, can help to meet this growing demand for data, and also increase the speed and reduce the costs of providing data. So another way of looking at what the partnership does is serve as a meeting place between supply – new sources of data – and demand – the data that governments and others need every day.
Making the most of this new opportunity means bringing together some different groups that previously haven’t worked together. Telcos are a really critical part of this picture, and we need them to be involved.
What the partnership is for is to bring together those different groups that previously haven’t worked together. None of the established institutions within the UN or elsewhere are really set up to broker that sort of collaboration because it is so new to everybody and we’re sort of making it up as we go along. I think telcos are a really critical part for that.
big data for social good
Figure 1: Global collaboration using Big Data is crucial for reaching the SDGs. 

What characteristics do you look for in the telcos that you work with as key factors in success for the partnership? Such as having a CDO, a data monetization process already in place or other factors. 


The heart of it is just a willingness to roll up their sleeves and get involved, a desire to be a part of this story. A desire to look beyond the narrow definition of the business model and think about what are some of the ways telcos can use the data they already have to reach beyond the services they are already offering. Sometimes that’s about trying to create new business opportunities and platforms, and sometimes that’s also combined with corporate social responsibility. Other times, the impetus is a more political engagement with the government over regulating and institutional frameworks. There are a lot of ways in.
But what we really look for is just a desire to engage and a willingness to experiment. One of the things which is so exciting is the range of models that are emerging for that experimentation to take place. 
That is very flexible, depending on the particular problem you are trying to solve and the particular business model of the telco. We have some models that are about transferring data to a third party and the data analysis and innovation being done there, and other models that are about putting the algorithm into the data, so the data remains in the company – the question going in rather than the data coming out. There are lots of different methods emerging and new ones on the horizon, so the important thing is to just keep trying.


There has been a lot of talk in the media about the SDGs being under threat with everything going on politically in the world right now. Do you think these movements that we’re seeing around the world will slow down the push towards more open data and more data awareness in the political realm? 

I think there are some immediate threats, of course. There are always political twists and turns coming from anywhere, and we should be expecting that in the fifteen-year period of the goals. But at the most basic level, I am still quite optimistic because I think people haven’t changed. Governments change, but ultimately people still want good healthcare, good schools for their kids, to be able to breathe the air when they go outside, to live in a good house and all of the rest of it, and that is really what the sustainable development goals are about. It’s a framework within which to define what people want.
One of the things that I was involved with in a previous job in the lead-up to the sustainable development goals was a huge global survey that involved 10 million people. We were asking people what their priorities were and tried to feed that into the governments who were working on the goals. And the things that people wanted were all the things I’ve just listed: jobs, healthcare, school and all the things you would expect. That hasn’t changed, so ultimately in order to stay in power, democratic governments still have to offer people what they want, and that aligns with the agenda of the goals.
bIg data for social good
Figure 2: GPSDD works to leverage data around the world in support of the SDGs.


What were you doing before you joined GPSDD? 

I was the managing director at the Oversees Development Institute, which is a think tank based in London. I have never worked in the private sector, but have jumped around in my career between civil society organizations, academia, and a bit of time working in the UN before GPSDD.


You joined GPSDD in October 2016. What are you proudest of in your time there so far?

Well, it’s been quite a short time. But the two trips I’ve done most recently to Kenya and Ghana were very interesting because we are working very closely with the governments to achieve their own priorities and to help them broker the relationships they need in the private sector and with other governments. Both trips helped me to really understand the power of the global network and the power that brokering these partnerships can have. In both cases, we have incredibly strong, committed and dynamic government partners who are amazing and a privilege to work with. And they have a clear sense of what they want to do and how they want to do it. They really value the role of the partnership in helping them open doors and adding that extra political impetus that sometimes working with an international organization can bring. 
For example in Ghana, we worked with the Ghana Statistical Service to organize a national forum on data and were able to bring together lots of different government ministries, civil society organisations, and companies. The vice president of Ghana gave the keynote address, and it was a great way to use that moment to create high-level political support to help them achieve what they want to achieve.
Both of those trips left me with a really strong sense of the power of the global brokering network and what it is we can do with it in working with partners.

Would you say that the partnerships you can form through GPSDD have more value for developing countries, or is it rather a matter of different use cases for each country?

I think it is going to look very different in different countries, but all countries are really excited about them. If you look at what is happening in the UK now, the Office of National Statistics is engaging with data science and trying to rethink in a fundamental way how governments engage with citizens and the way that they use data to drive decisions and help them run their services. A lot of that is based around experiments they are doing with Big Data. So there is a huge agenda there for rich countries, but it is different agenda, as is often the case. Here in the UK, for example, we have a very well-managed system of civil registration so we roughly know how many people live in the country at any given time. Whereas that is not really the case in places like Ghana. There may well be ways that telco data can be used to help fill those gaps that exist in Ghana that don’t exist in the UK.
On the other hand, some of the things that are happening in countries like Kenya and Ghana are more along the lines of leapfrogging over what is done in countries like the UK or the USA. They are finding ways to use Big Data and its technical solutions to drive service delivery in ways that are jumping a few generations ahead of what is even going on in some of the richer countries at the moment. So I think there is a lot to be done in all countries. But what they do is going to look a bit different depending on where they are starting from and what their priorities are.
Figure 3: The East Africa Open Data Conference is an example of GPSDD’s work (photo: GPSDD)


Does this leapfrogging tendency that you are seeing have to do with cost, speed or for the sake of innovation? 

I think it is a bit of both. It is, quite rightly, a cost driven thing, because if you can do the same thing as well but cheaper, why would you not do that? That is one of the great benefits that some of these technologies can bring, and then that frees up money for something else and that is all for the good. It is also partly about speed


One of the huge benefits of Big Data, and telco data in particular, is speed and being able to know what is happening now. 


Traditionally, many low-income countries have relied on survey data to track outcomes such as health outcomes, population movement and things like that. But when you do a survey, sometimes you don’t get the results for two or three years. So some of the experiments that are being done to address this are using mobile phone top ups as a proxy for poverty data, meaning that you can get a reasonably accurate map of poverty in your country every day, whereas traditionally governments are used to seeing a two- to three-year timeline on that.

So as well as cost, speed is the other huge attraction here. Speed in terms of what you can know and how that informs better policy making, but also to run better services and get better feedback.
This isn’t just about telco data but also the use of a mobile phone as a communications device, such as to help nurses in rural clinics to report on when drugs are out of stock. Rather than sending a letter or some cumbersome faxed piece of paper that then has to be handed between 17 different departments, you can just set up a system where you can connect straight to the relevant procurement department in the ministry of health and out comes the drugs. UNICEF has been developing this sort of system in some countries and availability of drugs in rural areas has gone up hugely.
There is a cost factor, a speed factor and a responsiveness factor. Those are just three of the really good reasons to try and leapfrog.


Finally, what would be your wish in going forward with partnerships in order to make things happen faster and more effectively?

There is always going to be a slow track and a fast track. Some of these things you should do slowly and carefully, like the more research-oriented methodological work. For example, working out what sort of methods should be used to combine mobile data with survey data, with census data, with data from satellites, to really create a 3-D picture of their country. These sorts of things take time because they are difficult to work out so they happen slowly.
But the big jumps that can be made are the big barriers that I see on the political and economic side rather than the technological side. On the technological side, either we know a lot of what is possible or we know how to find out. But on the political side, the questions are about the ways to manage the new systems that are emerging that will work for everybody and how to create the right incentive structures to make it easier for data to flow between institutions, or at least the insights to flow between institutions. That’s partly about data flowing from the private sector to the public sector, but it’s about data flowing within government departments.
What are the institutional, legal, and regulatory changes that can be made to help that data flow faster? There are also the investment challenges. What are the political arguments that can be used to encourage governments to invest in the capacity they need? 


When I was in Kenya, some of the government departments that I met had really constrained capacity. They only had one or two highly qualified statisticians in the central department and even fewer out in the districts. So in those cases, even if they did get access to loads and loads of data, it would not be massively useful because they would not be able to actually get the insights from it.

It’s about investments and things that need to go together around better legal frameworks and economic incentives that allow you to date more easily, and about the investments that also make sure that we’re all better at using that data.