Machine Learning identifying rare genetic disorders

AI of Things    18 February, 2019

Did you know that Machine Learning is already being used to help doctors identify rare genetic disorders by analysing images of people´s faces? 

The quantity of genetic illnesses is so overwhelming that in some cases it’s difficult to reach a definite diagnosis because, although each one has varied characteristics that differentiate them form one another, a lot of the time the symptoms present themselves in a similar way.

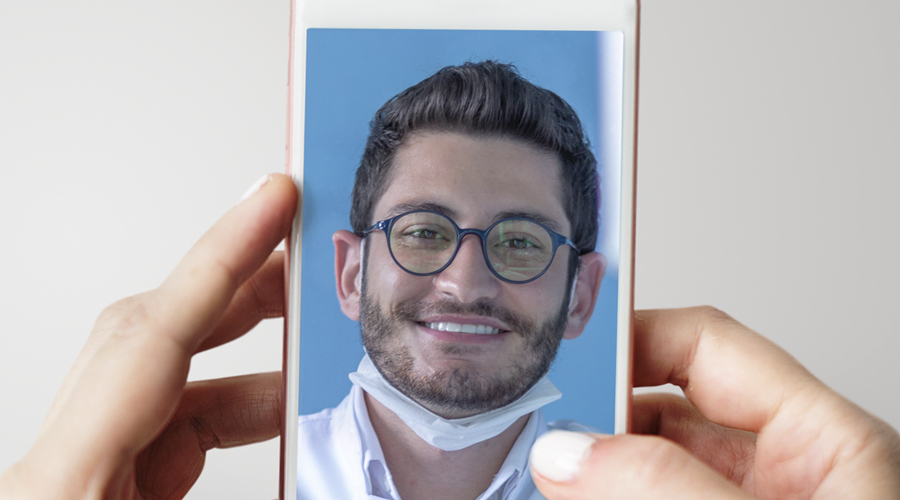
A magazine Nature Medicine has just published an article about an app for smartphones, Face2Gene, that is capable of identifying different facial features in photos that are derivative of certain genetic and neurological disorders.   

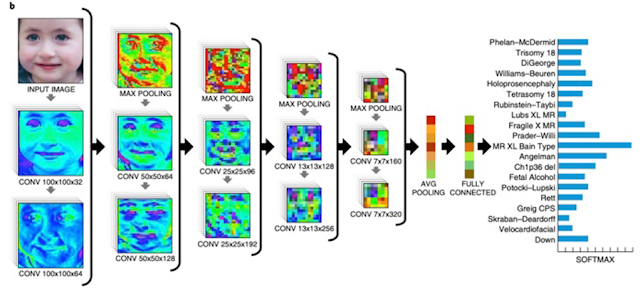
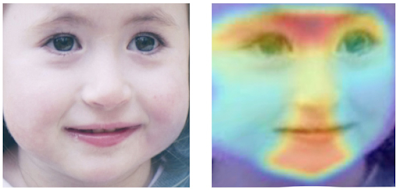
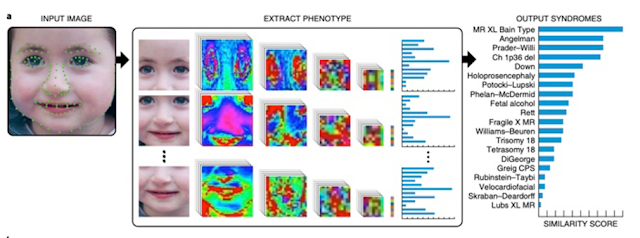
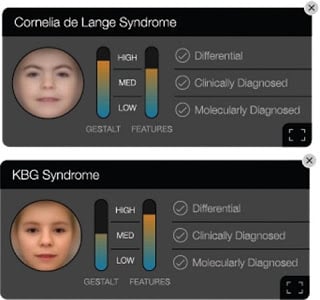
This technology analyses the patient photo using descriptive facial mathematics that are shared with the gestalt of different syndromes. It then quantifies their similarity and offers a prioritised list of syndromes with a similar morphology.

Face2Gene was created by the FDNA, one of the leading companies in artificial intelligence applications for genetic diagnosis. Their initial objective was to create an app that was capable of identifying syndromes such as Angelmann, Noonan and Cornelia de Lange, three rare genetic disorders with distinct facial characteristics.

Figure 2. Source: FDNA

To do this, they fed the algorithm more than 17,000 images of diagnosed cases that included 216 different syndromes, which resulted in exceptional diagnosis results. 

This app does not pretend to provide definitive diagnoses. Doctors use it for a second opinion or even as a point of reference when they don’t know how to interpret a patient’s symptoms involving rare genetic disorders.

Figure 3. Source: FDNA

Thus, Artificial Intelligence acts as a way of achieving a more accurate diagnosis, a way of saving time, and as a way of saving costs associated with ´amplified range´ genetic testing that will no longer be a necessary means of radically limiting the list of possible diagnoses. 

In order for Face2Gene to be able to offer strong diagnoses, it needs data. The good news is that health professionals agreed to upload patient photos to the application (that now has over 150,000 available images on its database), which has improved the programs precision.

Figure 4. Source: FDNA

It´s fundamentally important that a lot of data is shared in order to avoid racial biases and to achieve a balanced representation of different populations so people all around the world can be treated. 

Early diagnosis is crucial for these types of illnesses. It is amazing to think that one day soon we may hear that paediatricians and geneticists are able to use these kinds of apps with the same ease with which they use their stethoscope. 

Don’t miss out on a single post. Subscribe to LUCA Data Speaks.

You can also follow us on TwitterYouTube and LinkedIn

A much safer world is possible thanks to IoT

Beatriz Sanz Baños    15 February, 2019

The police forces usually use reactive methods to stop the damage generated when a crime occurs. However, security measures are being transformed into more preventive actions by allowing them to predict where and how crimes will be committed.

The main novelty provided by these proactive methods, based on IoT software, is objectivity; because these technological solutions determine what events have happened, but not how they should be dealt with. Deciding how to act against crimes corresponds to the police and judicial institutions, which collect all this information that is being collected about the crimes that are occuring, who the victim was, where they have occurred or what type of crime has been committed.

Security measures are being transformed into more preventive actions

Through the digitalization of the data (Artificial Intelligence algorithms and the cloud) databases are being created that collect all this information. The patrols have managed to depict patterns of activity and adapt their surveillance actions according to the data and therefore offer a more effective service and stop the crime before it occurs.

Crime prevention methods through IoT

  • Integrated video surveillance

The technology of integrated video surveillance allows a video analysis that collects information such as the density of a group, the number of people and the analysis of behaviors. The installation of these video surveillance devices in certain venues will help to collect data about the crimes in the places where they were committed and thus redirect the information to the police centers, which will mean a greater speed in the investigation process.

  • ShotSpotter

ShotSpotter is a system of sensors that allows to delimit, in a range of three meters, the location of a shot of a firearm. This technology is based on employing acoustic and optical sensors, distributed geographically in an area, that detect a shot and send a signal to the police officers in order to turn the conflictive neighborhoods into much safer ones. This type of technology has already been implemented in more than 90 countries. Eddie Johnson, superintendent of Chicago, describes it as “the technology that has most helped reduce armed violence in the city of Chicago.”

  • Panic button

One of the best known technologies in terms of IoT and security is the panic button, which consists of a button that when pressed it sends a signal to the police informing that the user is in danger. This device is integrated in many homes and is based on facilitating technology to users in dangerous situations.

There are also mobile phone companies, aimed at the senior population sector, who have decided to integrate a panic button on the devices themselves. Likewise, there are similar services aimed at guaranteeing the safety of minors. This is the case of Movistar Protege, which, in addition to monitoring the Internet activity of the children, has geolocation and a panic button to send, in case of emergency, a help request message indicating the exact location of the child.

  • Facial recognition

The Japanese company NEC is a leader in integrating IoT and Artificial Intelligence with images captured by cameras and offers the most accurate and fastest facial recognition system in the world – according to the National Institute of Technology Standards of the United States (NIST). This type of technology is key to public safety, as it will allow to track critical places such as airports, ports or power plants and identify suspects in a much faster and more efficient way. The police corps of China and the United Kingdom already use special facial recognition glasses to check people’s faces against their criminal databases.

A safer world is possible thanks to IoT

The extension of all these solutions connected between the different police forces will be fundamental to strengthen public safety and the fight against crime, thus guaranteeing better spaces for people. A safer world is possible thanks to IoT.

Artificial Intelligence converts thoughts into speech

AI of Things    13 February, 2019
Neuroscientists at Columbia University have discovered a ground-breaking way of turning thoughts into speech, that could potentially give individuals who have lost their ability to speak a voice. Professor Mesgarani and his team from Colombia University are using Artificial Intelligence (AI) to recognise patterns that appear in someone’s brain when they listen to speech. The AI is similar to the algorithms used by Apple for Siri and Amazon for Alexa.

Using computer processing software, scientists monitor brainwaves of patients who are unable to vocalise thoughts. They also use neural networks, along with the technology able to channel brain activity into the device to be translated into speech.

Neural networks are fundamentally based on connections, strengths and functions. It is a model that, taking inspiration from the brain, is composed of layers (at least one of which is hidden) consisting of simple connected units or neurons followed by nonlinearities. What makes Neural Networks special is their use of a hidden layer of weighted functions called neurons, with which you can effectively build a network that maps a lot of other functions. Without a hidden layer of functions, Neural Networks would be just a set of simple weighted functions. The networks, as in the biological brain, are able to transmit signals from on to the other.

Figure 1. This technology could give people a voice
The aim of the experiment was to teach the Vocoder to interpret brain activity using patterns of neural behaviour. By mimicking the structure of neurons in the brain, they were able to produce a robot sounding voice, that was able to almost perfectly translate the patients brainwaves. The process began with neural signals transmitted from the patient’s brains. They then used future extraction networks to decode the signals, and then feature summation networks to prepare the signals to be inputted into the vocoder and generate reconstructed speech.

Researchers tried to decipher the brains´ language signals by monitoring parts of the brain when people read aloud and listened to recordings. By compiling this data, they were able to covert the brain signals into words and simple sentences humans would be able to understand. The nature of the collection of the data was very invasive, and so the researchers could only do it for 15 minutes at a time.

They trained a Vocoder using epilepsy patients that were undergoing brain surgery to treat their condition, which is a computer algorithm capable of synthesizing speech after being trained. Vocoder analyses and synthesizes human voice signals, it then takes these signals and compresses them to emit manipulated sounds. The process resulted in around 75% of thoughts being translated per patient.

The study first used Linear and Spectrogram models to establish a baseline. They then used a vocoder to generate a Deep Neural Network (DNN) and combined this with the original spectrogram. The highest result of objective and subjective intelligibility quality scores was from the combination of the DNN and vocoder, which produced sounds that are clear to the listener. The technology is able to reconstruct the words the person hears and artificially generate them with a staggering rate of clarity: have a listen for yourself!

Figure 2. Sound waves
Famously, the scientist Stephen Hawking, diagnosed with ALS at just 21, used a rudimentary version of speech synthesis to communicate. He used a system that involved a cheek switch that connected to his glasses and then chose words spoken by a voice synthesizer. The findings made by the team at Columbia University has the potential to cut out the middle man, the computer, so individuals would be able to produce speech without the help of a computer or movement-sensitive system. 

There are, of course, limitations to these developments, mainly due to the small size of the sample used. To take the technology farther many more studies will need to be done on much larger sample sizes to obtain reliable results that can be transmitted to a larger public. There is also the issue of individualization. As in the days of early speech recognition systems, the algorithms and decoders need to be individualized for each user.

However, the team at Columbia University have definitely given hope to those without the ability to verbalize thoughts. With many people around the world suffering from devastating illnesses that prevent their ability to communicate verbally, this advancement could be a turning point in medicine and give people the chance to have a real voice.


You can also follow us on TwitterYouTube and LinkedIn

The “Cable Girls” of today

Beatriz Sanz Baños    11 February, 2019

Technological revolutions, such as the growth of Internet of Things, generate disruptive social changes. One of the most important consequences is the great boost they generate for the development of gender equality.

Similarly, to the effect of the invention of the telephone and the creation of large companies such as Telefónica, which meant the active incorporation of women into the labor market in Madrid in the 20s of the last century, the development of IoT also It is a great step for the promotion of equity and women´s rights in the workplace.

The “Cable girls” of yesteryear are the developers of today’s IoT software solutions that make life easier for millions of people around the world.

Female talent is key in the digital transformation. The management of diversity in the business sector is a competitive factor that encourages innovation and generates value for society in general. To achieve these objectives, it is essential to guarantee equal opportunities, reduce the lack of women in positions of responsibility and move forward in the development of good practices.

The “Cable girls” of yesteryear are the developers of today’s IoT software solutions

Telefónica’s Women In Leadership program is a prefect example of this, it aims to accelerate the professional career and increase the level of visibility of women with great leadership potential within the company. The program includes elements of leadership training, digital skills, mentoring and networking.

The connected technological solutions also favor the reconciliation between family and work life. The labor flexibility offered by companies such as Telefónica today allows its employees to be much more productive and for men and women have equal in opportunities when tackling ambitious professional challenges.

One example of this has been the launch of “Intelligent Work” at Telefónica, a formula which allows employees to have flexible working hours, which they choose based on their objectives. In this way, initiatives such as teleworking are encouraged. In addition, collaborative work spaces have been made available to employees and has given access to a greater availability of schedules and varieties of shared work have been facilitated to improve the balance between work and personal life. Also, the company has provided teachers and caregivers for the children and the WMAD Community has been created, which brings together all these employees to offer them a support network.

Another case that demonstrates the technological feminine protagonism is the European Center for Women and Technology (ECWT), a European association composed of more than 130 organizations that counts among its members with women experts in technology development and women that come from governmental, business, academic and non-profit organizations. This organization works to increase the number of girls and women in technology, guarantee the gender dimension of the digital agenda and integrate women in design, research, innovation, production and the use of ICT; including training plans in digital skills and Smart Cities.

Female talent is key in the digital transformation

Initiatives such as this strengthen the female role in the technological industry. Among the women with important roles in the sector, we pay tribute to Ginni Rometty, CEO of IBM and responsible for the cloud platforms and data analysis of the company; Susan Wojcicki, CEO of YouTube; Meg Whitman, who has held senior management positions in Silicon Valley companies, as president and CEO of Hewlett Packard; Safra Catz, co-CEO of the Oracle software giant, or our colleagues at Telefónica IoT: Sandra Fernández Curias, Innovation&Scouting Manager and Rosalía Simón, Director IoT Product.

The International Day of Women and Girls in Science reminds us once again the importance of women in technological innovation and the application of IoT solutions. Technological development is possible thanks to everyone. Therefore creating a much more humane world, connecting people´s lives with their needs and improving their day to day with IoT.

Python for all (4): Data loading, explorative analysis and visualisation

Paloma Recuero de los Santos    11 February, 2019

Now we have the environment installed, and we have had some practice with commands and we have learnt the various libraries, and which are the most important. The time has come to start our predictive experiment.

We will work with one of the most highly recommended datasets for beginners, the iris dataset. This collection of data is very practical because it’s a very manageable size (it only has 4 attributes and 150 rows). The attributes are numerical, and it is not necessary to make any changes to the scale or units, which allows a simple approach (as a classification problem), as well as a more advanced one (such as a multi-class classification problem). This dataset is a good example to use to explain the difference between supervised and non-supervised learning. 

The steps that we are going to take are as follows:

  1. Load the data and modules/libraries we need for this example
  2. Exploration of data
  3. Evaluation of different algorithms to select the most adequate model for this case.
  4. The application of the model to make predictions from the ´learnt´

So that it isn’t too long, in this 4 th  post we will carry out  the first two steps. Then in the next and last one, we will carry out the 3rd  and 4th.

1. Loading the data/ libraries/ modules

We have seen, in the previous post, the large variety of libraries that we have at our disposal. There are distinct modules in each one of these. But in order to use the modules as well as the libraries, we have to explicitly import them (except for the standard library). In the previous example some of the libraries are needed to check the versions. Now, we will import the modules we need for this particular experiment.

Create a new Jupyter Notebook for the experiment. We can call it ´Classification of iris´. To load the libraries and modules we need, copy and paste this code:

Continuing on, we will load the data. We´ll do this directly from Machine Learning UCI repository. For this we use the pandas library, that we just loaded, and that will be useful for the explorative analysis of the data, because it has data visualisation tools and descriptive statistics. We only need to know the dataset URL and specify the names of each column to load the data (‘sepal-length’, ‘sepal-width’, ‘petal-length’, ‘petal-width’, ‘class’). To load the data, type or copy and paste this code:

You can also download the csv of the dataset onto your working directory and substitute the URL for name of the local file.

2. Data exploration

In this phase we´re going to focus on topics such as the dimension of the data and what aspect it has. We will do a small statistic analysis of its attributes and group them by class. Each one of these actions doesn’t it is not more difficult than the execution of a command that, in addition, you can reuse again and again in future projects. In particular, we will work with the function shape, that will give us the dimensions of the dataset, the function head, which will show us the data (it indicates the number of records that we want it to show us), and the function describe, that will give us the statistical values of the dataset.

Our recommendation is that you try it one by one as you continue to find each one of the commands. You can also type them directly or copy and paste them in your Jupyter Notebook. (use the vertical shift bar to get to the end of the cell). Each time you add a function, execute the cell using (Menú Cell/Run Cells).

As a result, you should get something like this:

Figure 2: Results of applying the commands to the datset exploration

And so, we see that this dataset has 150 instances with 5 attributes, we see the list of the first 20 records, and we see the distinct values of longitude and the width of the petals and sepals of the flower that, in this case, correspond to the Iris-setosa class. At last, we can see the number of records that there are in the dataset, the average, the standard deviation, the maximum and minimum values of each attribute and some percentages. 

Now we will visualise the data. We can produce graphs of a variable, which will help us to better understand each individual attribute, or multivariable graphs, which hallows us to analyse the relationship between the attributes. Its our first experiment, and we don’t want to over complicate it, so we will only try the first ones. 

As the beginning variables are numerical, we can create a box and whisker plot diagram, which will give us a much clearer idea of the distribution of the starting attributes (longitude and width of the petals and sepals). For this, we just have to type or copy and paste this code:

By executing this cell, we get this result:

Figure 3: Box and Whisker plots.

We can also create a histogram of each attribute and variable to give us an idea of what type of distribution follows. For this, we don’t need to do more than add the following commands to our Jupyter Notebook (as in the previous example, better to do it one by one):

We execute the cell, and we get this result. At a first glance, we can see that the related variables are the sepals, they appear to follow a Guissiana distribution. This is very useful because we are able to use algorithms that take advantage of the properties of this group of distributions.

Figure 4: Histograms.

And so now we´re almost finished. In the following post we will finalise our first Machine Learning experiment with Python. We will evaluate different algorithms around the conjunction of validation data, and we will choose which offers us the most precise metrics to expand our predictive model. And, at last, we will use the model.

The posts in this tutorial:

Don’t miss out on a single post. Subscribe to LUCA Data Speaks.

You can also follow us on TwitterYouTube and LinkedIn

Artificial Intelligence Fighting Fraud and False Declines

AI of Things    7 February, 2019
Through the use of Decision Intelligence and Artificial Intelligence Express platforms, Mastercard have harnessed the power of predictive analytics and machine learning to reduce the rate of false decline by half. Algorithms make the call on whether a payment is valid, and sometimes these err on the side of caution and get it wrong, costing more money than actual card fraud.

Mastercard acquired AI specialist company Brighterion, leading to a significant increase in their ability to detect fraud and reduce false declines. The key improvement comes from the ability to analyse data in real time. Machine Learning algorithms are incredibly efficient, allowing them to analyse over 75 billion transactions around the world annually, that the Mastercard Network processes, adding to their global reach.

Before, transactions were declined based on a static sample dataset with fixed rules, whereas today they use a sophisticated constant flow of data streams, code and self-teaching algorithms. The AI is able to process over 1.9 million rules per transaction in a millisecond, thus becoming a fully automated and highly efficient process.

AI has helped the company avoid billions of dollars’ worth of fraud by analysing consumer behaviour and patterns. The system combines anonymised and aggregated customer data with geographical data to reveal ´normal´ transactions as well as patters of fraudulent activity in those areas, effectively building a digital consumer fingerprint. It uses the insights gained from the consumer data profile to spot discrepancies and decide if a transaction is fraudulent or verified. The systems are no longer experiencing a learning lag as their ability to self-teach and learn means they are always updated, resulting in a reduction in system latency due to super-fast user verification.Due to the rapid growth of the Internet of Things (IoT), automated transactions are rising to handle the sharp increase in digital commerce. The data must be of high quality for the software to run efficiently. AI infrastructure can prove to be very costly, so it is essential that businesses ensure this investment will be implemented correctly to solve/aid these problems and streamline the process.

Mastercard claims to put the customer first, with the seamless and easy point-of-sale being the focal point of their core strategy, but they will also keep in mind the benefits to investors (banks) as well.
The AI technology can also prove to be very useful when flagging money laundering schemes. The algorithm can detect and examine patterns of transactions and see if a group or business is acting in a suspiciously coordinated way, thus acting as ammunition against the smartest cyber criminals.

Natural Language Processing (NLP) is also deployed here. Using algorithms to interpret natural language essentially allows computers to understand what humans are saying. The NLP technology can detect connections between names, which can prove incredibly useful when fraudulent individuals or groups are using false names or aliases to avoid detection.

Ajay Bhalla, president of the company´s global enterprise states that: “What it does is goes through billions of transactions and figures out what is the propensity of the transaction being fraudulent, and it gives these insights to the bank in the system, when the transaction goes through for authorisation. It has helped the company catch billions of dollars’ worth of fraud by analysing consumer behaviour and patterns.¨ Bhalla predicts that AI is going to become ever more essential across the financial sector as more commerce is done digitally, and criminals become more and more sophisticated.

You can also follow us on TwitterYouTube and LinkedIn

Medical video assistance thanks to IoT

Beatriz Sanz Baños    6 February, 2019

Much has been said about the arrival of Internet of Things in numerous sectors such as industry, home automation or even leisure, but little, however, of its application to medicine; a sector that concerns us all, because it is directly focused on the health of people and their well-being.

The IoT applied to healthcare has been implanted little by little in clinics and hospitals and is already part of the daily life of thousands of chronic patients.

IoT applied to hospitals

This technology, through sensors and specific devices connected to each other, has many benefits, as it not only helps monitor patients’ medical data in real time, it can also be done remotely. Thanks to this patients don’t have to go to the medical center constantly and it favors the decongestion of the waiting rooms of the emergency centers.

Another of its applications is to monitor the medical hardware virtually, which in many cases saves or sustains lives, and whose failure due to a power outage can be disastrous. For this the company Phillips has developed e-Alert, an IoT technology that alerts in advance of any possible technical problem.

The IoT applied to healthcare has been implanted in hospitals and is already part of the daily life of thousands of chronic patients

IoT in patient care

The monitoring of health parameters through sensors is not the only tool that the Internet of Things offers to healthcare. Some steps have been taken in recent years to create solutions that offer improved medication administration. There are already pills with microscopic sensors that send signals to an external device and remind which medication is needed and guarantee, when ingested, that the patient has received the appropriate dose. Patients, in this way, have access to information from their smartphone through an app that tracks their health status.

These solutions are especially interesting for those who suffer from chronic illnesses that significantly limit their quality of life. The company Health Net Connect is an example of a program focused on patients with diabetes, which aims to improve their quality of life and improve the management of their illness.

In Spain we find applications such as Gádaca, which make use of the latest technology to connect patients with doctors through video attention with a simple click and 24 hours a day. The company is developing IoT solutions that will expand the service in the future. It will deliver elements that measure the tension or the cardiac pressure to the users and that, by means of sensors, send the data to the mobile application of the patient and to the device of his doctor.

The IoT technology also contributes to the generation of telerehabilitation services. It’s the implementation of distance rehabilitation therapies, in which patients perform the exercises from home with sensors and biometric devices in an interactive environment while the physician monitors their progress from a Hospital.

The IoT technology also contributes to the generation of telerehabilitation services

Another variant of medical care with images is digital twin technology. It is a simulated model that forms a virtual representation of the human body, or of some of its structures, from the data obtained from the population and from each patient; thus making it possible to carry out personalized tests on the impact of the different treatments. ANSYS, a company specialized in simulation, provides this type of software, which allows, for example, to simulate the upper respiratory tract to optimize the administration of chemotherapeutic drugs in oncological patients or to reconstruct the blood vessels to choose the most appropriate way to surgically treat an aneurysm.

This is only the beginning of what Internet of Things can do to improve the lives of people, knowing what their physical conditions are and controlling the treatments they have to incorporate according to the advice of health professionals.

Python for all (3): ScyPy, NumPy, Pandas…. What libraries do we need?

Paloma Recuero de los Santos    5 February, 2019

We are taking another step in our learning of Python by studying what the modules are, and, in particular the libraries.  We will see what purpose some of them serve and lean how to import and use them.

What are the modules?

The modules are the form in which Python stores definition (instructions or variables) in an archive, so that they can be used after in a script or in an interactive instance of the interpretation (as in our case, Jupyter Notebook). Thus, we don’t need to return to define them every time. The main advantage of Python allowing us to separate a program into modules is, evidently, that we are able to reuse them in other programmed modules. For this, as we will see further on, it will be necessary to import the modules that we want to use. Python comes with a collection of standard modules that we can use as a base for a new program or as examples from which we can begin to learn.

Python organises the modules, archives .py, in packages, that are no more than folders that contain files .py (modules), and an archive that starts with the name _init_.py. The packages are a way of structuring the spaces by names of Python using ´names of modules with points´. For example, the number of the module A.B designates a submodule called B in a package called A. Just as the use of modules prevents the authors of different modules from having to worry about the respective names of global variables, the use of named modules with points prevents the authors of packages of many modules, such as NumPy or the image library of Python (Python Imaging Library or PIL), from having to worry about the respective names of modules.

└── paquete 

    ├── __init__.py 

    ├── modulo1.py 

    ├── modulo2.py 

    └── modulo3.py

To import a module, use the instruction ´Import´´, following with the name of the package (if applicable) more the name of the module (without the .py) that you wish to import. If the routes (or what are known ´namespace´) are large, you can generate an alias by modifying ´as´:

The modules should be imported at the start of the program, in alphabetical order and, first the ones of Python, then those of the third party, and finally, those of the application.

The standard Python library

Python comes with a library of standard modules, in which we can find all the information under The Python Standard Library. To learn about syntax and semantics, it will also be good to have to hand The Python Language Reference. The standard library is very large and offers a great variety of modules that carry out functions of all kinds, from written modules in C that offer access to system functions like access to files (file I/O).

Python installers for platforms such as Windows, normally include a complete standard library, including some additional components. However, Python installations using packages will require specific installers.

A stroll through the standard library

The standard library offers a large variety of modules that carry out all times of functions. For example, the module OS offers typical functions that allow you to interact with the operative system, like how to tell in which directory you are, change directory, find help functions, the maths module that offers trigonometry functions, logarithms, statistics etc. There are also modules to access the internet and process protocols with urillib.request, to download data in a URL and smtplib, to send emails; or modules such as datetime, that allow you to manage dates and times, modules that allow you compress data, or modules that measure returns.

We don´t include examples so we don’t drag ourselves out too much, but if you´re really interested in learning, we recommend you test these modules one by one) from the Python Shell, or through Jupyter) with this small walk through the standard library that you can find in official Python documentation.

Virtual environments 

However, the applications of Python often use packages and modules that don´t form part of the standard library, in fact Python is designing a way to facilitate this interoperability. The problem in which we find ourselves, common in the environment of open coding, is that applications frequently need a specific version of the library, because that application requires that a particular bug has been fixed or that the application has been written using an outdated version of the library interface.

This means that it may not be possible that Python installations complies with the requirements of all the applications. If application A needs version 1.0 of a particular module and application B needs version 2.0, there requirements are therefore conflicting and to install the version 1.0 or 2.0 will stop one of the applications working. The solution to this problem is to create a virtual environment, a directory that contains a Python installation from a particular version, moreover from one of the many additional packages. In this way, different applications can use different virtual environments. To resolve the example of conflicting requirements cited previously, application A can have its wen virtual environment with version 1.0 installed, whilst application B has its own virtual environment with the version 2.0.

Non-standard libraries

Given that the objective of our example is to carry out an experiment into the application of Machine Learning with Python to a determined dataset, we will need something more than the standard libraries that, even though offers us some mathematical functions, leaves us a little short.  For example, we will also need modules that allow us to work with the visualisation of the data. We will get to know what are the most common in data science:

  • NumPy : Acronym of Numerical Python. Its most powerful characteristics are that its able to work with an array of matrices and dimensions. It also offers basic lineal algebraic functions, transformed to Fourier, advanced capacities with random numbers, and integration tools with other languages at a basic level such as Fortran, C and C++. 
  • SciPy: Acronym of Scientific Python. SciPy is constructed around the library NumPy. It is one of the most useful with its grand variety of high-level modules that it has around science and engineering, as a discrete Fourier transformer, lineal algebra, and optimisation matrices..
  • Matplotlib: is a graphic library, from histograms to lineal graphs or heat maps. It can also use Latex commands to add mathematical expressions to graphs.
  • Pandas: used for operations and manipulations of structured data. It’s a recently added library, but its vast utility has propelled the use of Python in the scientific community. 
  • Scikit Learn formachine learning: Constructed on NumPy, SciPy and matplotlib, this library contains a large number of efficient tools for machine learning and statistic modelling, for example, classification algorithms, regression, clustering and dimensional reduction.
  • Statsmodels: for statistic modelling. It’s a Python model that allows users to explore data, make estimations of statistic models, and carry out test statistics. It offers an extensive list of descriptive statistics, test, graphic functions etc for different types of data and estimators. 
  • Seaborn: based in matplotlib, it is used to make graphs more attractive and statistical information in Python. Its objective is to give greater relevance to visualisations, within areas of explorations and interpretation of data.  
  • Bokeh: allows the generation of attractive interactive 3D graphs, and web applications. It is used for fixing applications with streaming data.
  • Blaze: it extends the capacity of NumPy and Pandas to distributed data and streaming. It can be used to access a large number of data from sources such as Bcolz, MongoDB, SQLAlchemy, Apache Spark, PyTables etc
  • Scrapy: used to track the web. It’s a very useful environment for obtaining determined data owners. From the home page url you can ´dive´ into different pages on the site to compile information.
  • SymPy: it is used for symbolic calculation, from arithmetic, to calculus, algebra, discrete mathematics and quantum physics. It also allows you to format the results in LaTeX code.
  • Requests for accessing the web: it works in a similar weay to the standard library yrllib2, but its much simpler to code. 

And now we suggest you do a simple exercise to practice a little. It consists of verifying versions of the Anaconda library that we have installed. On Anaconda´s web page, we can see this diagram showing the different types of available libraries (IDEs for data science, analytics, scientific calculations, visualisation and Machine Learning. As you can see, two libraries appear that we have not talked about, Dask and Numba. Thus, we must also investigate their use, and also check out which versions Anaconda has installed for us.

Figure 2:Diagram of the Anaconda environment.

For that, you don’t need to do anything more than write in your Jupyter notebook, or copy and paste the following commands, (with a slight modification for the libraries that don’t show).

With this post we now have everything prepared to start the Machine Learning experiment. In the next one, we will start downloading the data, and the explorative analysis. We´re nearly there!

All the posts in this tutorial here:

Don’t miss out on a single post. Subscribe to LUCA Data Speaks.

You can also follow us on TwitterYouTube and LinkedIn

The hugest collection of usernames and passwords has been filtered…or not (II)

ElevenPaths    4 February, 2019
Over the last entry we focused on analyzing the content of these files from a critical point of view, this is: on clarifying that when a massive leak freeing millions of passwords is announced, the reality is not entirely what it seems to be. After all, what it has been filtered is the collection of leaks, gathered over time by a certain group of people or by someone.
The leak we have examined has 640 Gb of content. We must clarify that it is not just the leak called “Collection #1” or the subsequent “Collection #2” and so on (the best-known ones). These types of collections are on the Internet, on several forums or uploaded on servers where anyone, with some patience, can access.

Even considering that the content of these files is not always the latest one, or that many data can be completely irrelevant, it is not only this aspect what we are worried about. These types of leaks make us feel vulnerable and show us sharply how privacy is marketed. However, there are other aspects to be analyzed. For instance, thanks to these leaks we can apprehend what are the interests of these traders, how these collections are built, what are the different origins of the files and (above all) what they are later used for.
From a constructive point of view, we are going to examine how the collection is structured as well as the potential origin of these files. We say “potential” because in most cases we cannot state categorically their origin with certainty.
On some files, the organization consists in TLD domains attributed to groups and countries. This would allow to target some kind of attacks (phishing and scam, in general) towards a certain type of organization or group with the same idiosyncrasy.

pc folders image


On this organization we can observe lists of leaks (very likely) coming from sites that could have been compromised, for extracting their databases as well as for injecting JavaScript code and consequently stealing the data from the form fields filled by the website visitors (who become then the second victims together with the website).

leaks list image


Sometimes, lists of thematic websites are gathered. This is interesting for attackers, since it allows them to successfully perform very targeted campaigns. Let’s imagine that the users of these sites receive an e-mail inviting them to enter their credit card data to gain a free month subscription or a discount. The attackers could even show the user’s password to be trusted. Of course, in case of pornographic or adults’ relations sites, they may also use the consumption of this kind of services as a mean of blackmailing users.


Video game selling sites list image


In the same way, they also have lists related to video game selling sites:

list image


As well as related to Bitcoin -or cryptocurrency in general- sites:

Cryptocurrency sites list image


There are more thematic divisions based on different types of services: purchases, streaming sites, etc.

The files usually include e-mails and passwords on a classic format: [email]:[password]. In other cases, information is rawly organized. This is, for instance, a direct database dump:

Direct database dump image


As a curiosity, we have created statistics based on the frequency of e-mail address domains in order to examine those that are more repeated within the various leaks. On the one hand, we must consider that some e-mails can be repeated in various files (we previously said that a high number of them were repetitions of the same e-mail within different leaks). On the other hand, certain e-mail services are more popular than other ones. Moreover, we must consider as well in which countries this leak can be more or less useful (in case of campaigns targeted by location).

Campaigns targeted by location image

Six of the domains are focused on Russia, two on France and two further domains on the United Kingdom. QQ is a service mainly used in China.

You may also be interested in:

Towards a new Big Data ecosystem to mitigate Climate Change

Richard Benjamins    3 February, 2019

Big Data can be used to help fight Climate Change [1],[2],[3]. Several projects have analysed huge amounts of satellite, weather and climate data to come up with ways to better monitor, understand and predict the course of climate change. Recognising the dramatic impact of climate change on our lives and that of future generations, many governments are designing policy measures to mitigate the effects. It is however complex to estimate, and later monitor, the impact of those measures, both on climate change and on economic activities.

One of the challenges governments face is to balance the mitigating measures with the impact on the economy. We believe that a combination of privately held data with public open data can provide valuable insights to both estimate and “quickly” monitor the impact on economic activities. This is the field of Business to Government (B2G) data sharing, whose value is well recognized as an enabler for solving important societal problems (e.g., by the European Commission, or TheGovlab).

However, currently not many of such initiatives exist, and most of them are in pilot mode. Therefore, the Spanish Observatory for Big Data, Artificial Intelligence and Data Analytics (BIDA) studies the possibility of a B2G data sharing initiative to provide future insights to policy makers on climate change measures and economic impact.

Spanish Observatory for Big Data, Artificial Intelligence and Data Analytics
Figure 1: Spanish Observatory for Big Data, Artificial Intelligence and Data Analytics

BIDA consists of around 20 large Spanish enterprises and public bodies and is a forum for sharing AI and Big Data experiences between peers. The initiative is looking into the possibilities to combine public and privately-held data (duly anonymized and aggregated) of its members into a common data lake to provide access to recognized climate change experts and data scientists. We believe that this would be one of the first occasions privately-held data would be shared for the common good on such a large scale. Applying AI and Machine Learning to such a unique data set has the potential to uncover so-far unknown insights about the relation between economic activities and potential measures to reduce climate change.

One of the key success factors for B2G sharing initiatives is that, from the beginning, potential final users are involved and commit to putting the system into operation if the results of a first pilot are successful. We therefore would like to take advantage of the Climate Change Summit in Madrid to:

  • invite policymakers and climate change experts to express their interest in this initiative, and
  • talk to experts to evaluate the opportunity of this unique initiative.

Climate change experts, policymakers and data scientists can express their interest by sending an email to [email protected] or to [email protected].

To stay up to date with LUCA, visit our Webpagecontact us and follow us on TwitterLinkedIn YouTube.


[1] https://www.weforum.org/agenda/2018/10/how-big-data-can-help-us-fight-climate-change-faster/

[2] https://www.bbva.com/en/using-big-data-fight-climate-change/ [1] https://www.mdpi.com/406212

[3] https://www.mdpi.com/406212

Leave a Comment on Towards a new Big Data ecosystem to mitigate Climate Change