Last month Google published its third annual security report on Android’s security protections, aiming to send a clear message to the world about mobile malware (or Potentially Harmful Applications (PHAs), as they like to call them): devices, apps, and Android users are safer than ever. And the entire Android ecosystem is now more secure.
Sending positive messages is ok, but is good to be realistic as well. That is what makes us all improve. We have squeezed some numbers and facts included on the report, to finally determine that it’s hard to believe that actually the Android ecosystem is as secure as Google claimed, as the used terminology is not clear and some showed numbers are not aligned.
It is all about “malware” definitions
According to the report, PHA are “applications that could put users, user data, or devices at risk”. This include among many others trojans, spyware, or phishing apps. That is ok, but, as Google recognized, “we are also less strict in our definition of certain PHAs than some users expect. A classic example is advertising spam, which we define as an app that pushes advertising to the user in an unexpected way, such as on the device home screen or lock screen”. This means Google does not count aggressive adware as PHA, which is the most common problem for Google Play users. There is no evidence of aggressive adware definition included in The Google Android Security Team’s Classifications for Potentially Harmful Applications. How this “advertising spam” or aggressive adware may it be? We do not know. Some “so called” advertising campaigns ended up rooting the device. This definitely makes the numbers go down and it is maybe one of the gaps antivirus companies and Google play with.
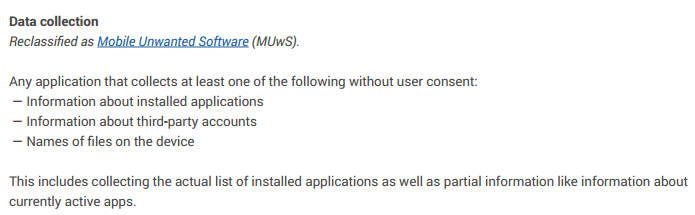
Another interesting point about PHA definition is that Google has removed a subset of the malware that could be considered as “spyware” from this taxonomy. Since 2016, Google introduced the concept of Mobile Unwanted Software (MUwS): “An example of common MUwS behavior is overly aggressive collecting of device identifiers or other metadata. Previously, we categorized some of these apps as PHAs, but to improve the clarity of our classifications we’re now classifying them as MUwS”. “We defined MUwS as apps that collect at least one of the following without user consent: Information about installed applications; Information about third-party accounts; Names of files on the device”.
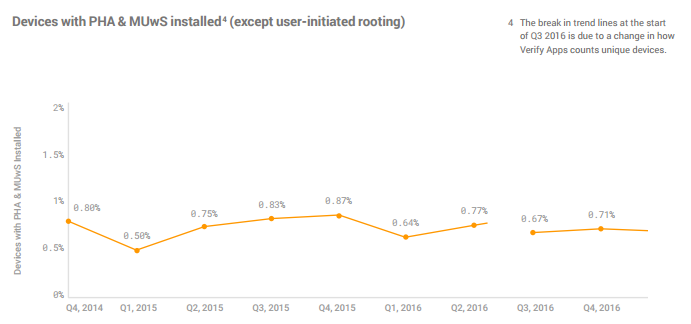
Spyware is still present as a category itself, but just if it collects “sensitive” information. Now we have to deal with two Google’s taxonomies for classifying apps: PHA and MUwS, which are potentially harmful and unwanted software. The question is then, how many devices have PHA and MUwS installed?
|
Actually this is the infection rate with PHA and MUwS included. Interesting to note that Google did not count infected devices as devices where the user himself has decided to root the telephone (something very common in some countries). At some point in 2016, they seem to have changed the way they count unique devices. Just before the infected rate was getting higher. We do not know how this used methodology affected the reported numbers.
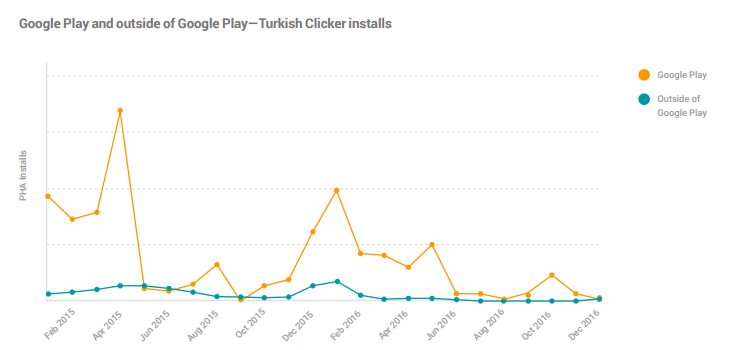
Moreover, Google dedicated some space in the report to talk about the Turkish Clicker, a relevant peace of malware we have followed since 2015, and confirmed by the Check Point research team. Although the Turkish Clicker malware family has been present on Google Play for a long time, and with active campaigns several times since 2014, it is not considered PHA by Google: “By itself, this click fraud behavior is not a PHA: clicking on HTTP links does not violate any of Android’s security boundaries or put user data at risk. This family has been classified as hostile downloaders because, in some cases, the ads unintentionally downloaded other PHAs to the user’s device”. Does this mean then that Turkish Clicker downloads and installations on Google Play are not included on this “PHA statistics”? This is confusing. When they specifically talk about this sample, they do not even draw which numbers of installs apply on the y-axis in this graph.
- Google stated that Android constitutes now more than 1.4 billion devices. The main headlines are that by the end of 2016, less than 0.71% of devices have a PHA installed. Therefore, it means they are infected. This goes down to 0.05% for devices that exclusively download apps from Google Play. That message could mean that malware is not a real problem for users… but, really? Some vendors stated that infection rates are just double, over 1.4%;
- A very good antimalware built-in tool for Android is Verify Apps. This proto-antivirus scanner is checking apps every 6 days now, at least. Verify Apps automatically blocks install attempts initiated by an installed PHA since September 2016.
- In 2016, only 0.02% of installs downloaded from Google Play were discovered to be false negatives. This means, “not detected by Google itself with their antimalware systems”. For installs outside of Google Play, the numbers are higher; the average false negative rate is 2.6% within the first 90 days. 0.02% is not a bad false negative rate, but we should take into account they have the right to disallow apps to get into Google Play;
- It seems that, with some kind of malware, the overall health of Google Play has increased year over year. However, in the same report they claimed SMS fraud apps had increased 282% and toll fraud 592% during 2016. It means 5 and 2 times more SMS fraud and toll fraud apps in the official store. Toll frauds are whatever other way (other than premium SMS or calls) that attackers may charge the user (WAP traffic, etc).
HummingBad: numbers do not add up
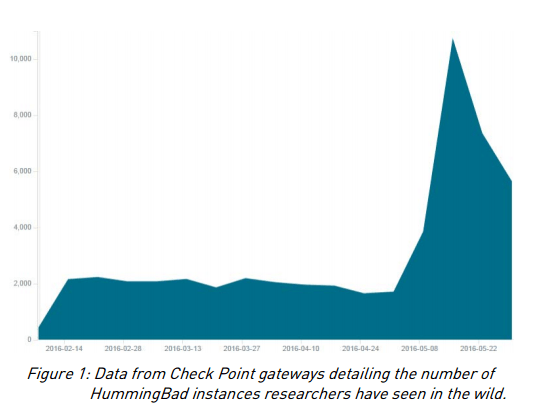
HummingBad and all its family around is a special case. HummingBad stands out as an extremely sophisticated and well-developed malware, and there is no doubt it was one of the biggest problems for Android users during 2016. It was first been discovered by Check Point on customer’s devices in February 2016, and it is a very aggressive malware that gets into Google Play from time to time and infect millions of devices (10 million victims, rooting thousands of devices each day and generating at least $300,000 per month). Check Point has detected and tracked it for a long time, so they have special and “first hand” statistics and reports for HummingBad. Check Point even got into the Command and Control and they know well how aggressive this campaign was. In this graph below, you could see how the HummingBad instances (unique devices infected) get high during May 2016 and then goes down to eventually die.
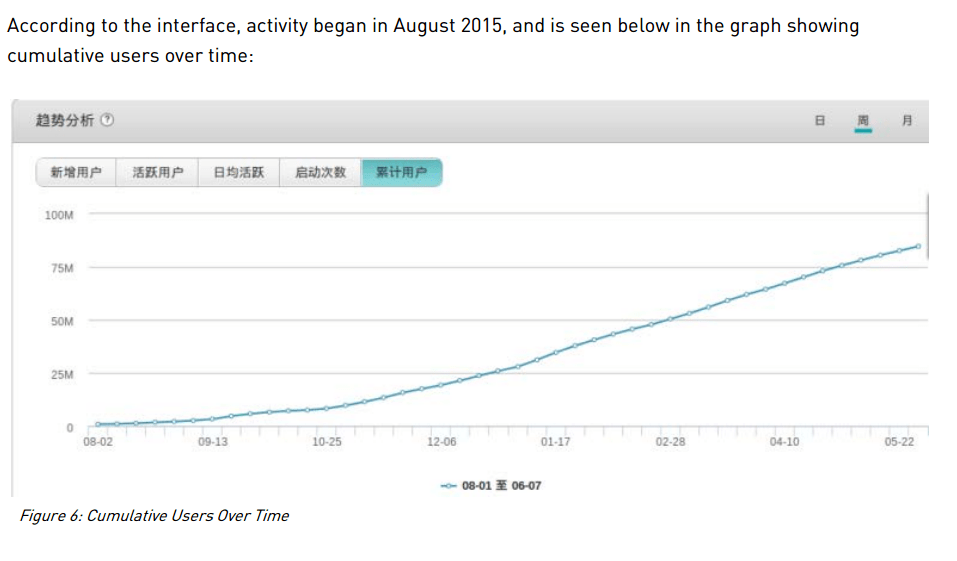
The lower figure shows an image of the control panel of Umeng (ad-company) obtained by Check Point, which revealed that users (and benefits) grow from 2015 to May 2016 as well.
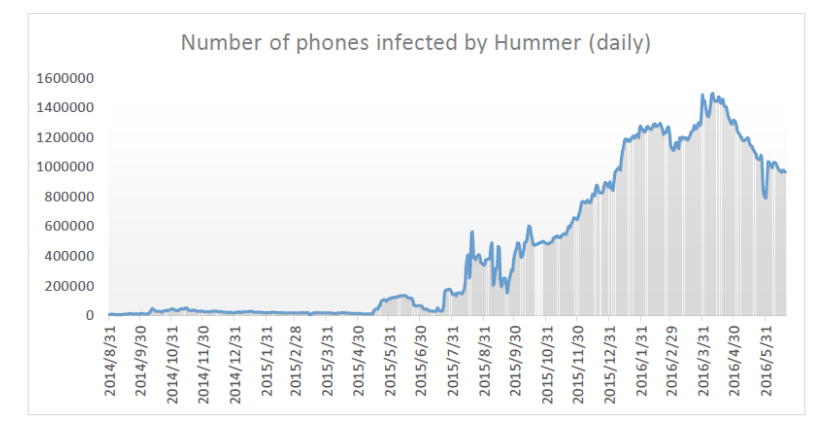
Cheetah Mobile also showed that the infections related with HummingBad went down in May.
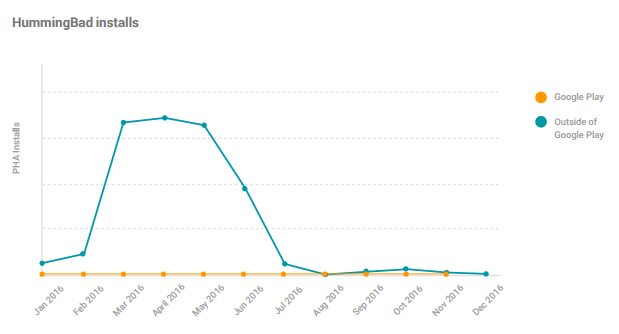
Google’s annual Android security report reflected HummimgBad installs on a different way. As showed below, they claimed HummingBad peaked between February and May of 2016, and then the installs went down very quickly, even quicker than Cheetah Mobile or Check Point seems to reflect (no y-axis explanation included on Goggle’s graph, so we do not know how much or how quickly). The HummingBad report from Check Point went out in July. Maybe this helped “cleaning” devices, but that is not clear. Maybe Google is not counting HummingBad straight consequences (more malware/PHA/HummingBad installs) as infections.
Moreover, Google claimed: “Of the 24,000 HummingBad apps with about 379 million installation attempts (25.1% of which were blocked or warned by VerifyApps), only one app was uploaded to Google Play and was suspended before it reached 50 downloads”. This is true as HummingBad did not get into Google Play the first time. However, it did the second time it returned publicly, at least in December 2016, when found by Check Point as a new variant of the HummingBad malware, dubbed “HummingWhale”, hidden in more than 20 apps on Google Play. This December come-back is not reflected in the charts…. Unsuspecting users downloaded the infected apps in this campaign several million times, but, according to the graph, infections in December inside Google Play are not even reflected (graph stops in November).
But, aside of this confusing data, Google showed the table below, where they stated they had blocked 99,96% of “install attempts”. This data spans April 2016 to December 2016. Therefore, it means the data showed by the report does not include from January to March, when the infection rate was higher.
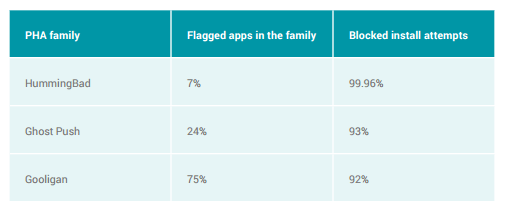
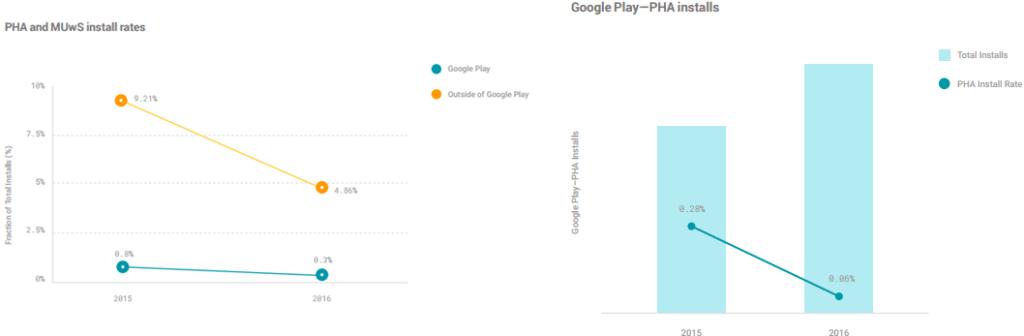
Figure: What are the conclusions exactly we should extract from these graphs? What is the percentage of PHA, MUwS or PHA+MUwS really installed?
Conclusions
As explained, it is hard to believe that actually the Android ecosystem is as secure as Google claimed, as the terminology used on the report is not clear and some showed numbers are not aligned. Google has improved Android security, it is not easy to break. However, do not forget that most of malware on Android does not mainly need, so far, to bypass security systems to take over the system or brake it. The user (weakest link of the security chain) is the one installing the malware and giving it the high permissions.
This 2016 report stated “a user was ten times more likely to download a PHA from outside of Google Play in 2016”. That means that Google Play is safer than alternative markets, but there is still a lot of work to do in order to protect actively users from application threats.
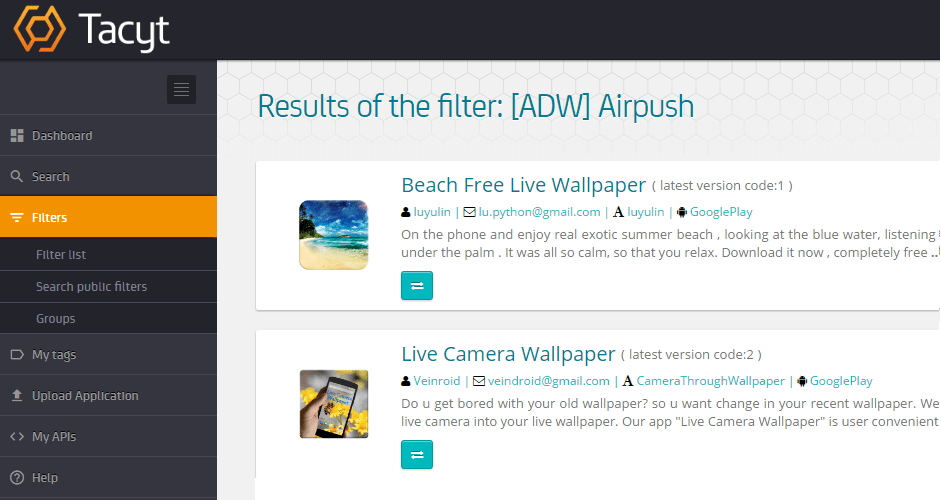
For example, playing with the ”malware” terminology, the graphs or “ignoring” aggressive adware or clickers as a PHA impact on report reliability. Specially when related with adware and privacy problems: Airpush, one of the well-known aggressive adware SDKs, is still quite frequent in the market, as we have seen with Tacyt screenshot below.
Aside, for malware present in Google Play and infected systems, numbers about HummingBad, HummingWhale are maybe not as good as shown in the Google’s report. As we said above, sending positive messages is ok, but is good to be realistic as well. That is what makes us all improve.


Very Interesting Post
Thank you a lot for providing individuals with a very
spectacular possibility to read critical reviews from this site.
Android Training in Bangalore
The best ways of iphone monitoring